Complete Results @ http://www.newx-forecasts.com/
Follow the left-panel link from '25th Annual Snow Storm Contest > Verified Forecasts > ‘Storm #3’ to see the complete forecasters’ verification table by station.
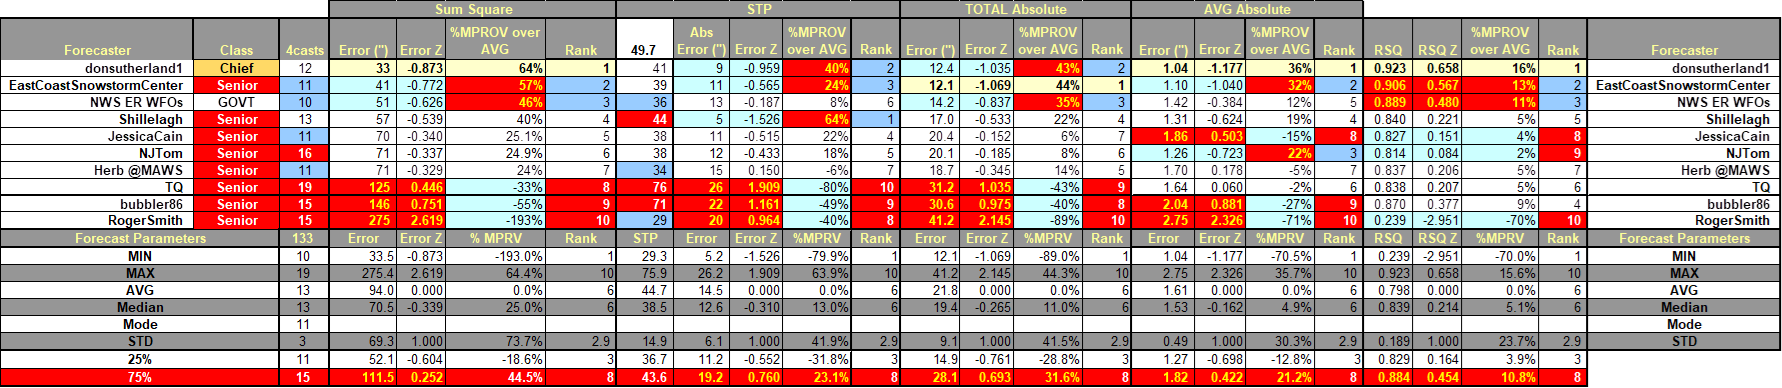
In the table ...
Yellow cells indicate the best score in category.
Forecast STP cells: yellow if within +/- 5% of observed STP.
Blue (Red) cells indicate the 1st (4th) quartile
SUMSQ: sum of square errors (measure of forecast accuracy accounting for magnitude and distribution of snowfall)
STP: storm total precipitation
TAE: total absolute error
AAE: average absolute error
Final Standings - all Forecasters
---
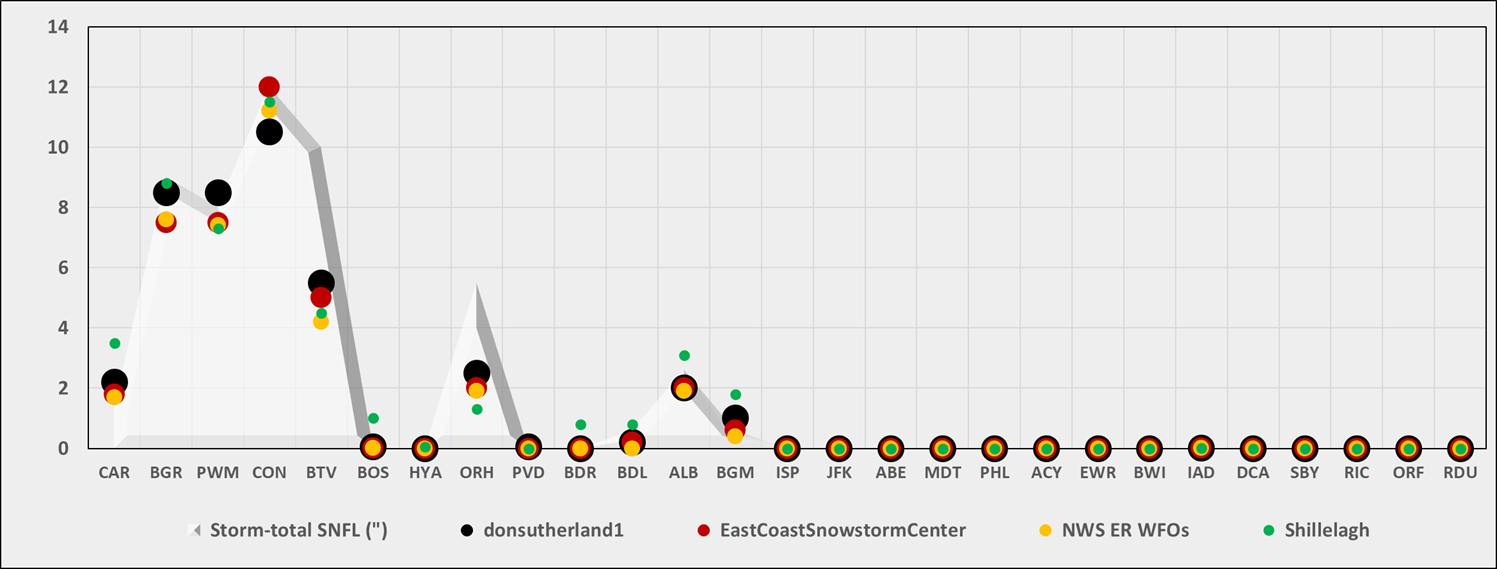
Station by Station Comparison of Top 4 Forecasts and Observed Storm-total Snowfall (STP)
---
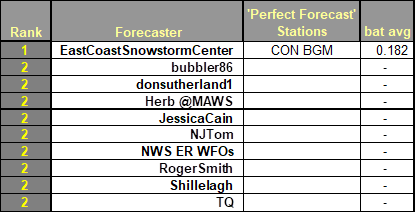
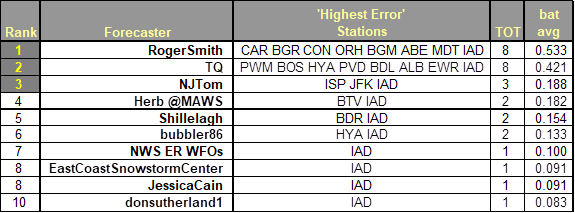
Perfect Forecasts (Batting Average - Forecast Stations with No Error)
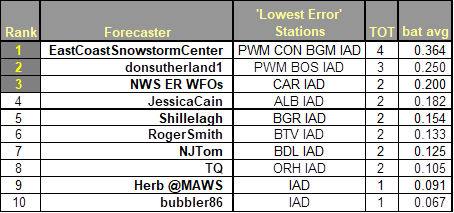
Best Station Forecasts (Batting Average - Forecast Stations with Lowest Absolute Error)
Best Station Forecast Busts (Batting Average - Forecast Stations with Highest Absolute Error)
Skill v. NWS ER WFOs
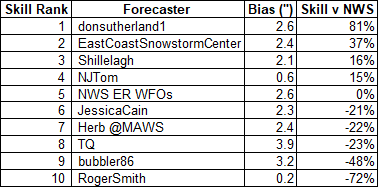
SKILL: positive (negative) skill value indicates a forecast/s improvement (downgrade) over the NWS forecast.
BIAS: arithmetic difference between the average Forecast snowfall and
the average Observed snowfall (averageForecast) – averageObserved).
---
Consensus Forecasts … Extremes … and Observed Snowfall
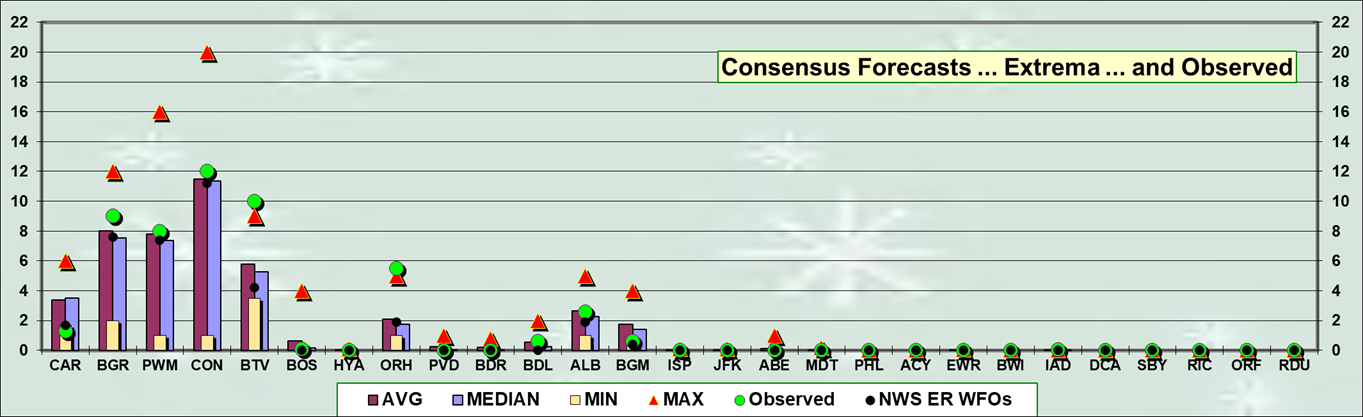
Consensus forecast best @ PWM … BDL …ALB
NWS forecast best @ CAR … CON
MAX forecast best @ BTV … ORH
MAX forecast less than observed @ BTV …ORH
MIN forecasts best @ CAR
MIN forecasts more than observed @
---
Total Absolute Error and SUMSQ Error
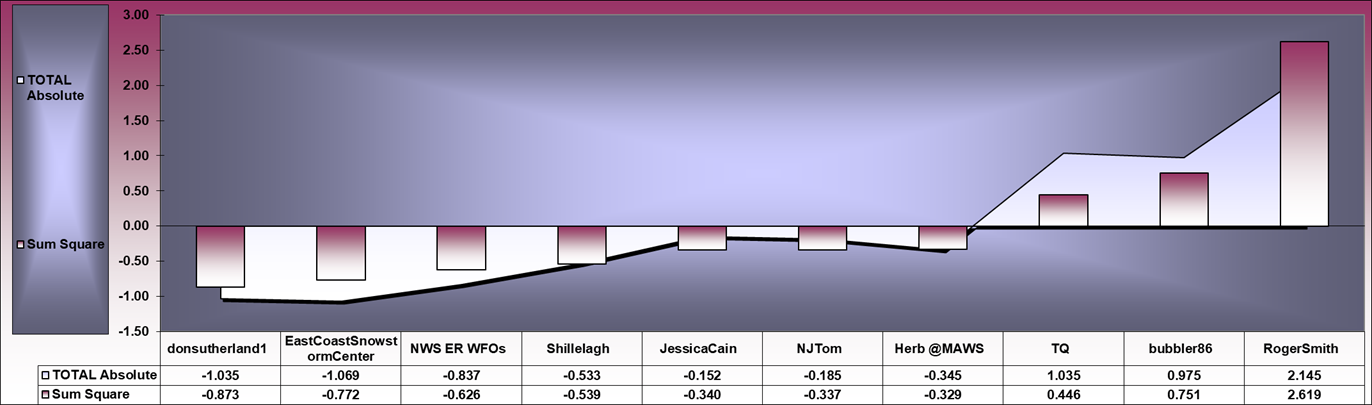
Strong correlation (R = 0.958) between SUMSQ and TAE Z-scores
---
Forecast by Observed Snowfall Scatterplots (Top 4 Forecasts)
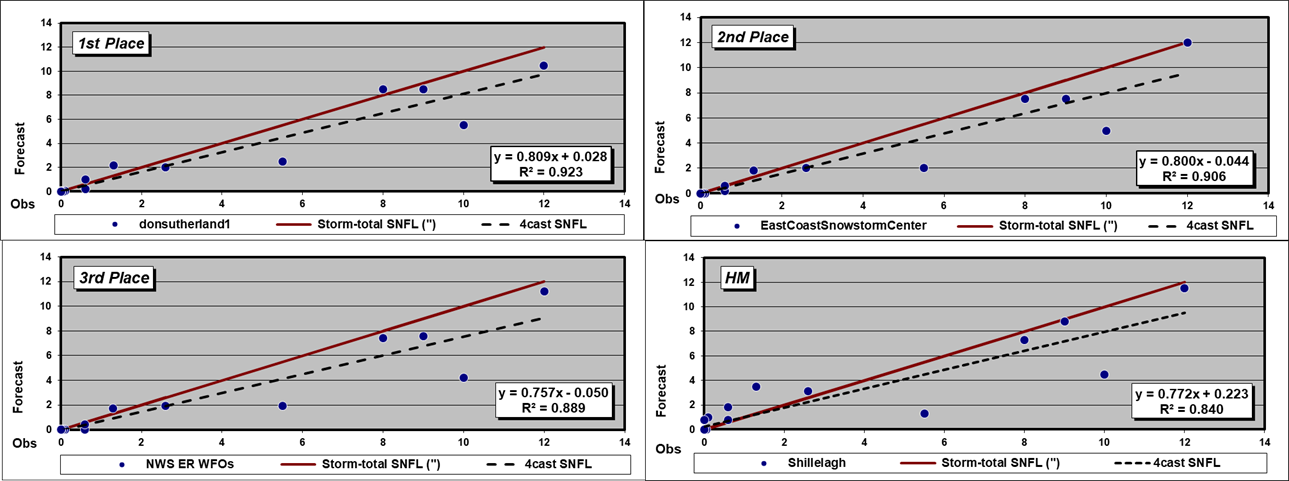
A Forecast dashed trend line above (below) solid red Observed snowfall line ==> over (under) forecast
R2 value indicates how well the forecast captured the observed snowfall’s variability … i.e., R2 = 0.874 ==> the forecast captured ~87% of the observed snowfall’s variability.
---
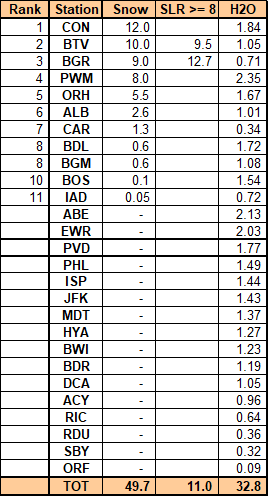
Storm-total Snowfall Verification
Verification of storm-total snowfalls for WED through FRI based on reporting from CDUS41 (CLI) ... CXUS51 (CF6) ... METARs ... and PNS bulletins issued by NWS.
Excellent coverage and reporting.
---
Snow-to-liquid ratios (SLR) less than 8:1 are not reported for stations with
measurable snowfall b/c significant liquid and / or freezing precipitation also
occurred during the verification period.
The 'TOT SLR' field is the quantity-weighted average of those forecast stations
with at least an 8:1 SLR.
---
Stations observing >= Trace: 11 (41%)
Stations observing > Trace: 10 (37%)
Given a station had measurable snowfall; stations observing at least:
4" - 5 (19%)
8" - 4 (15%)
10" - 2 (7%)
MAX snow melt-water (minimum SLR 8:1)
BTV - 1.05"
BGR - 0.71"
MAX precipitation (frozen + freezing + liquid)
PWM - 2.35"
ABE - 2.13"
EWR - 2.03"
---
New daily snowfall record(s)
04-APR-24
BTV - 10" (2.7"; 2004)
BGR - 9" (6"; 2007)
PWM - 7.1" (6.4"; 1915)
---
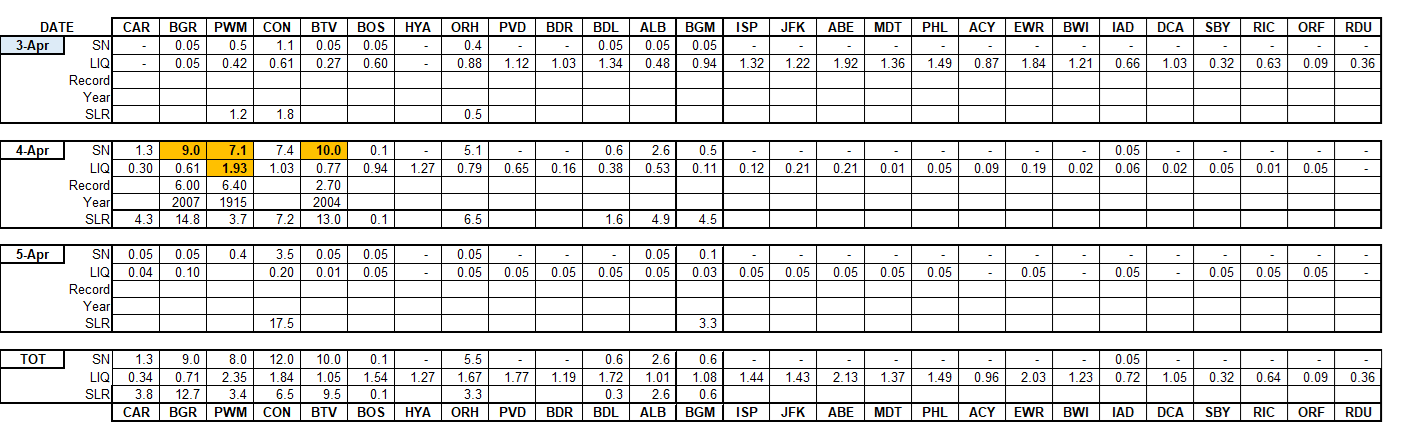
ORANGE cells: new daily record.
GREY cells: data source(s) - PNS and / or METARs.
Trace amounts (displayed as 0.05") not included in STP.
---
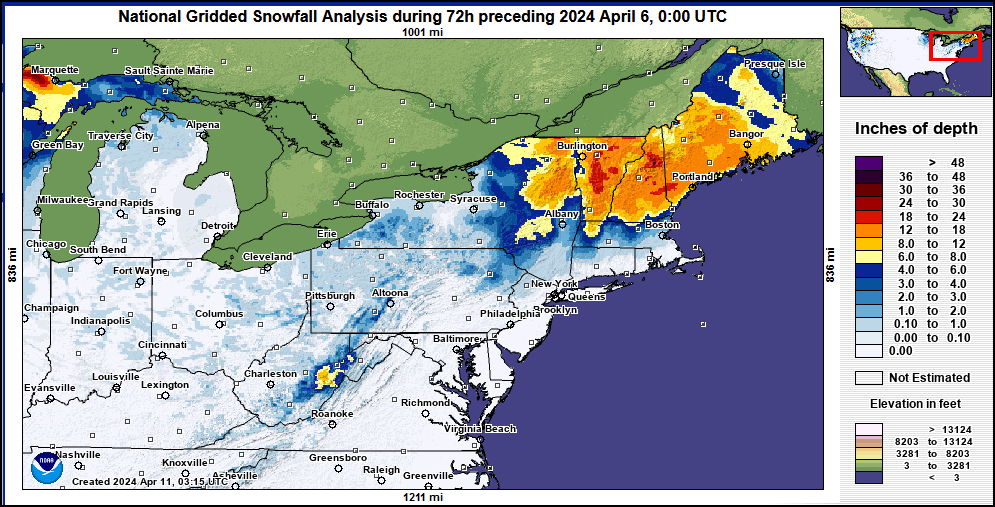
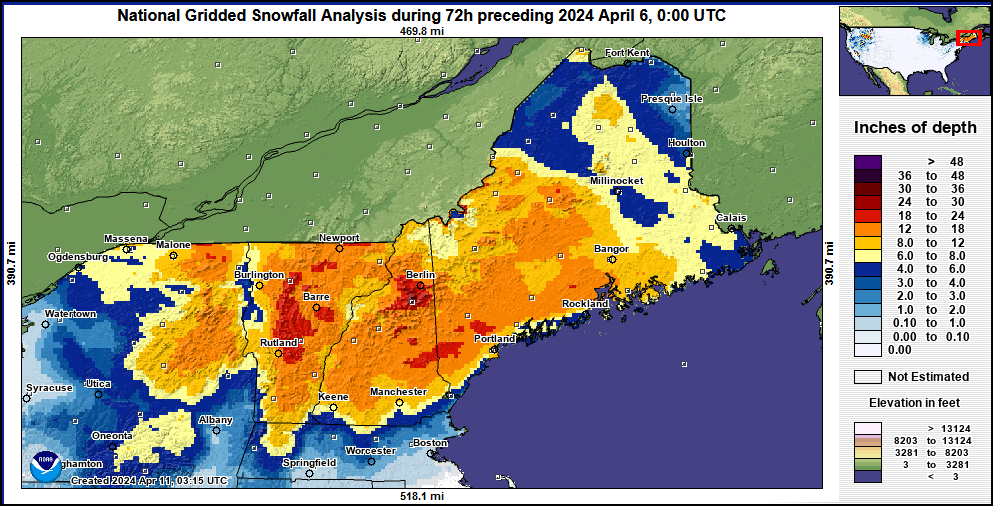
Approximate areal distribution of storm-total snowfall courtesy NOHRSC
---
SFC analysis: 12z ... 04-APR-24 and Storm-total Snowfall by Station
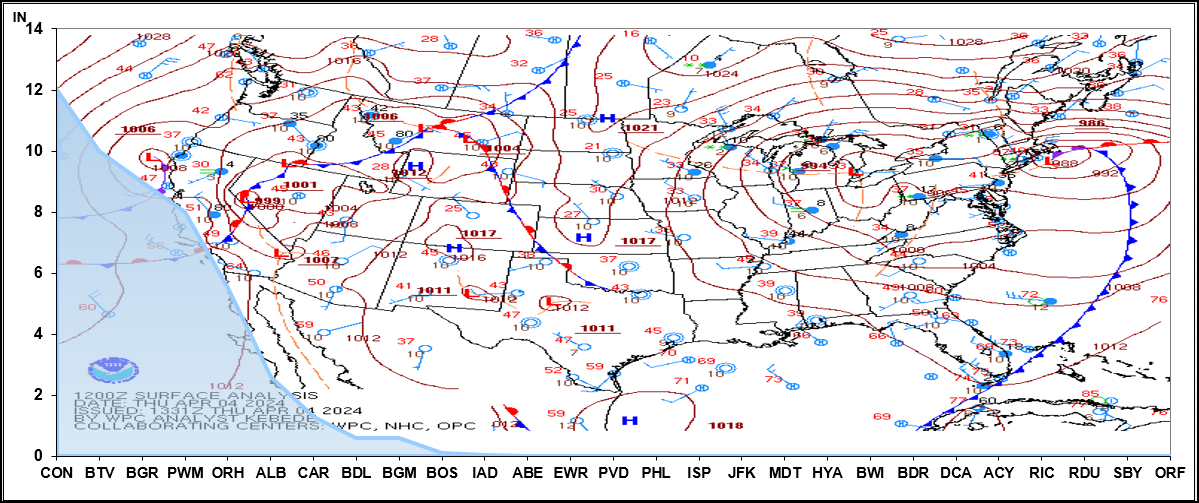
Images courtesy DOC / NOAA / NWS / NCEP / WPC
https://www.wpc.ncep.noaa.gov/html/avnsfc.shtml
---
Teleconnections
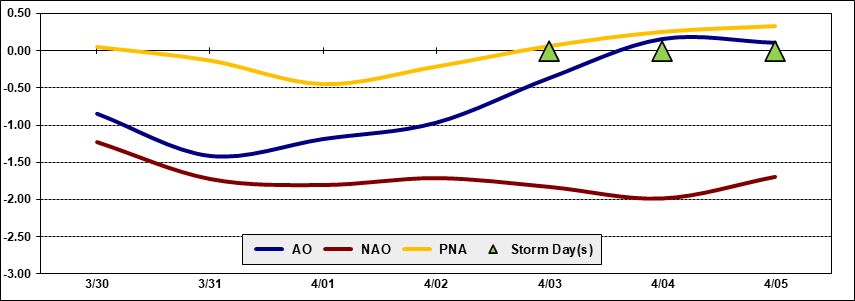
Teleconnection time-series data courtesy CPC
---
Upper Air
Upper air charts courtesy University of WY
---
SFC analysis
Images courtesy DOC / NOAA / NWS / NCEP / WPC
https://www.wpc.ncep.noaa.gov/html/avnsfc.shtml
---
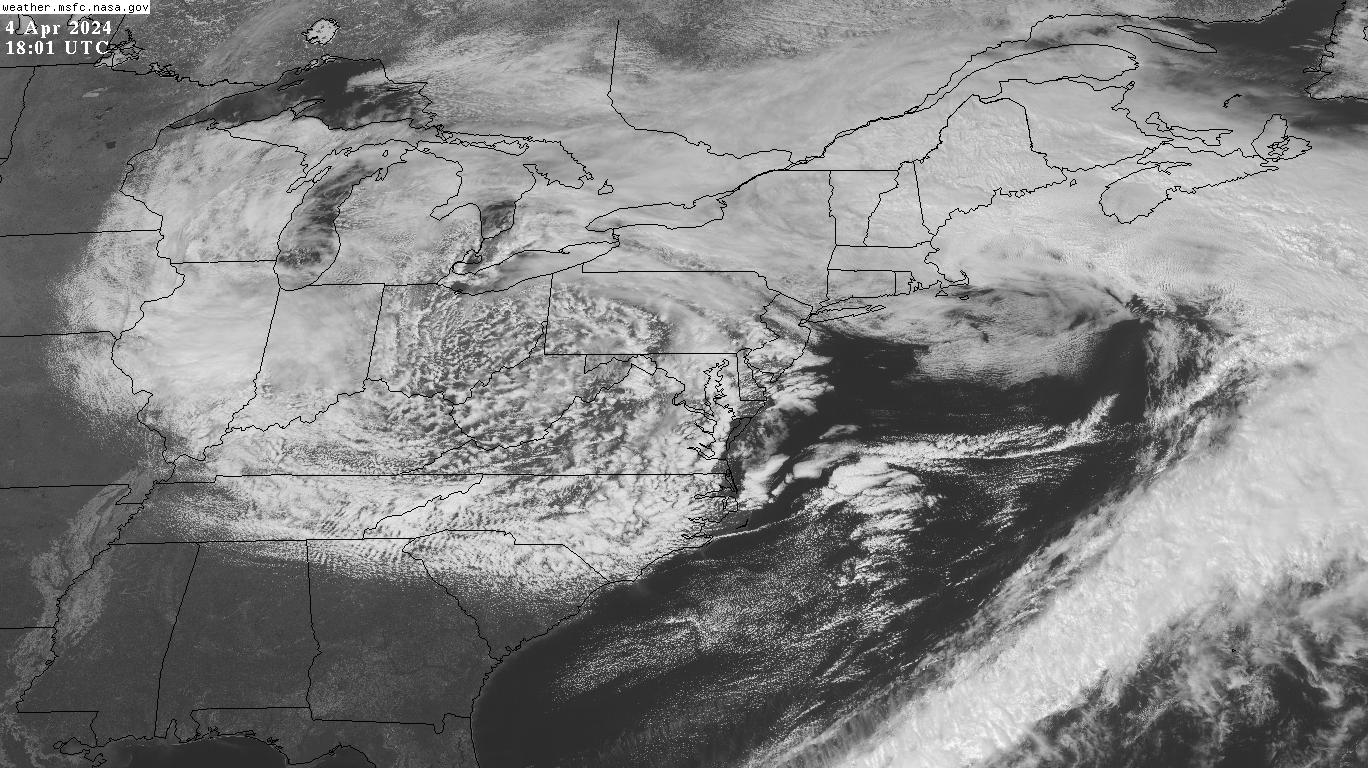
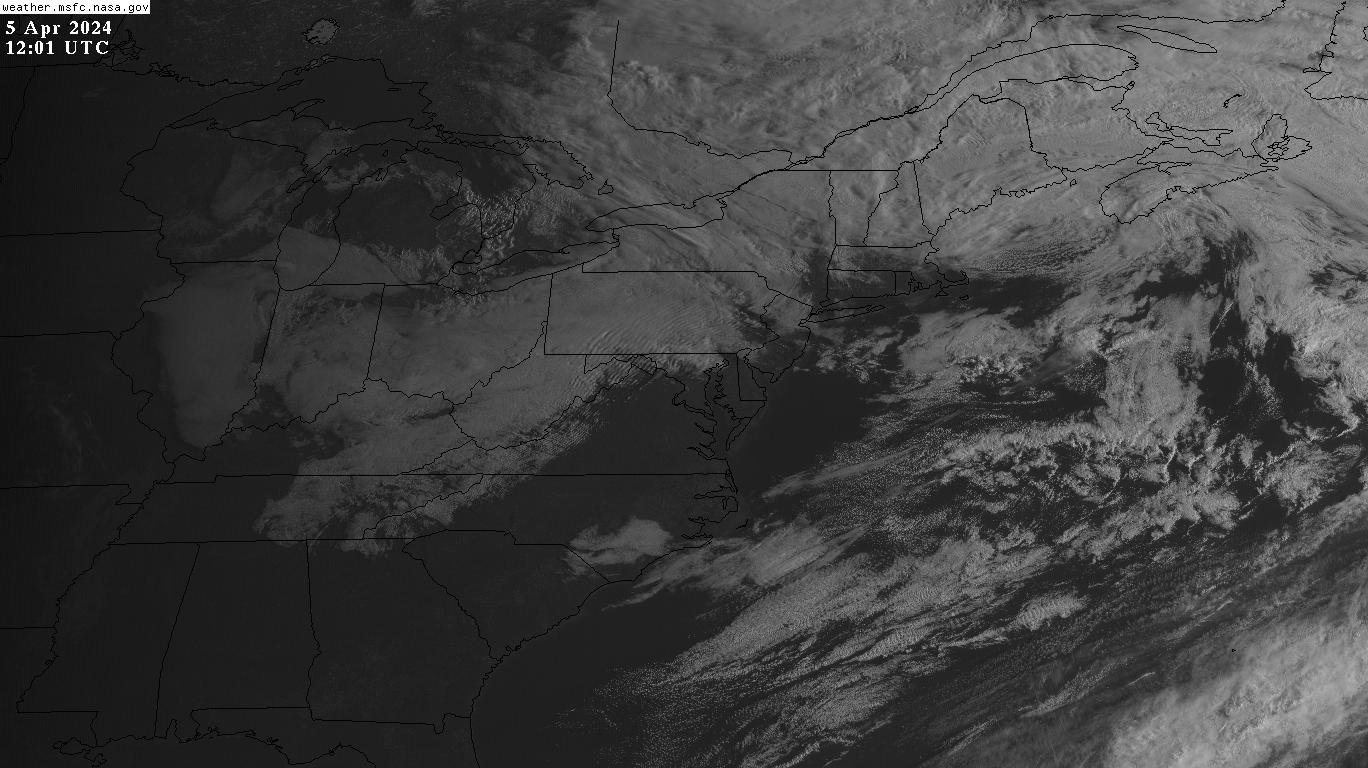
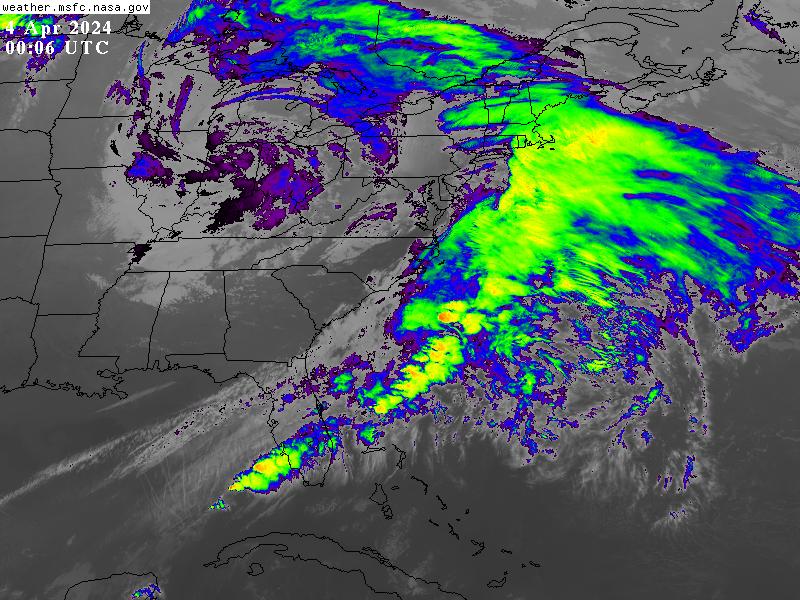
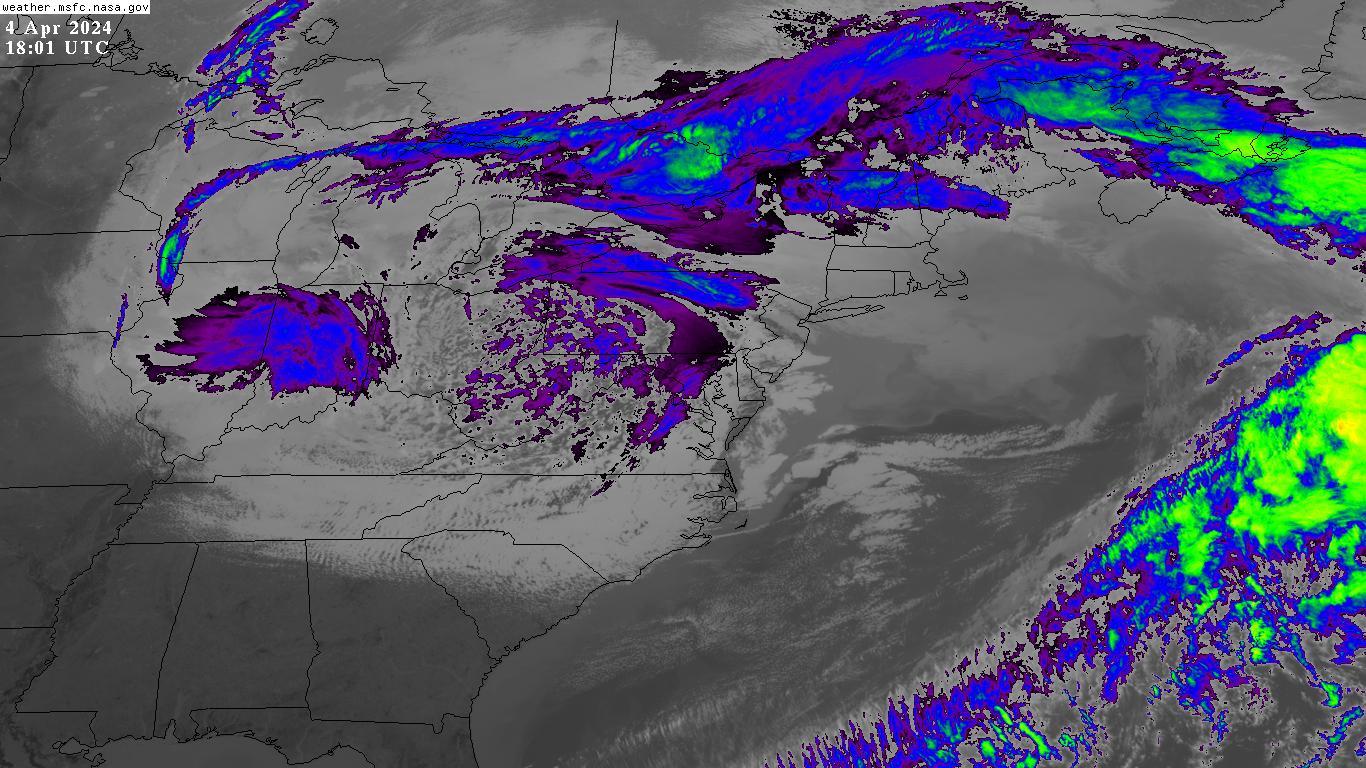
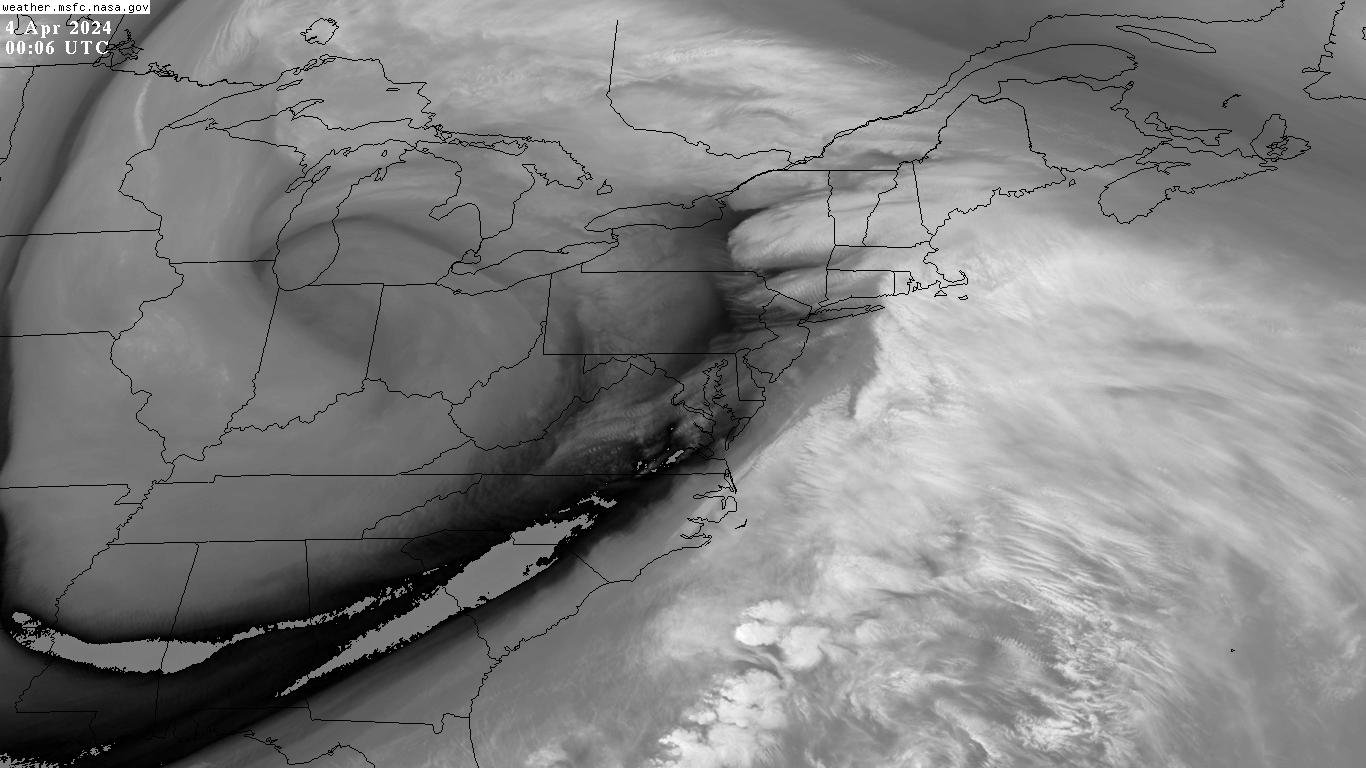
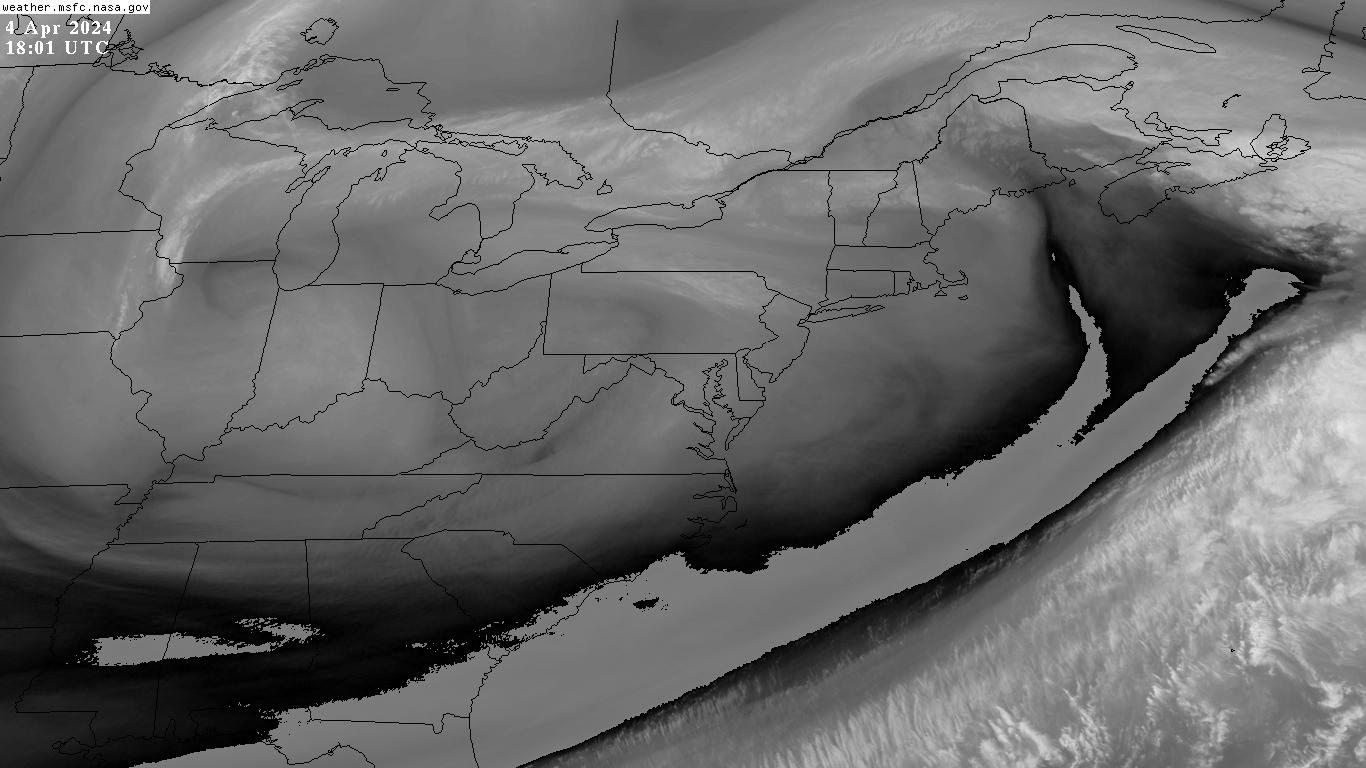
Satellite imagery courtesy George C. Marshall Space Flight Center Earth Science Branch
---
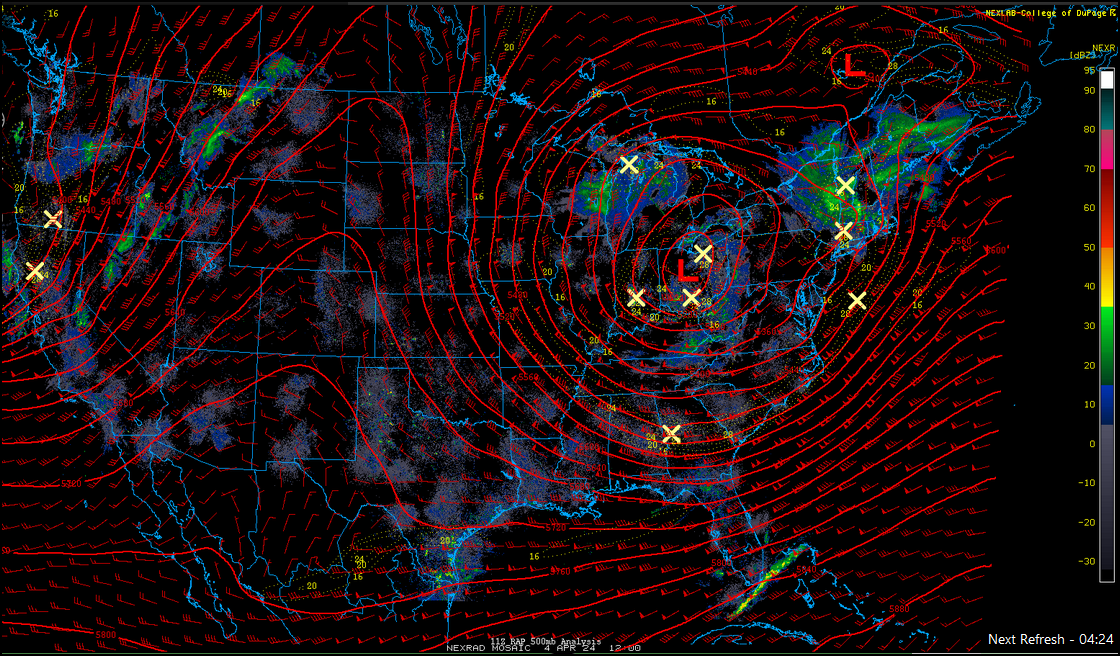
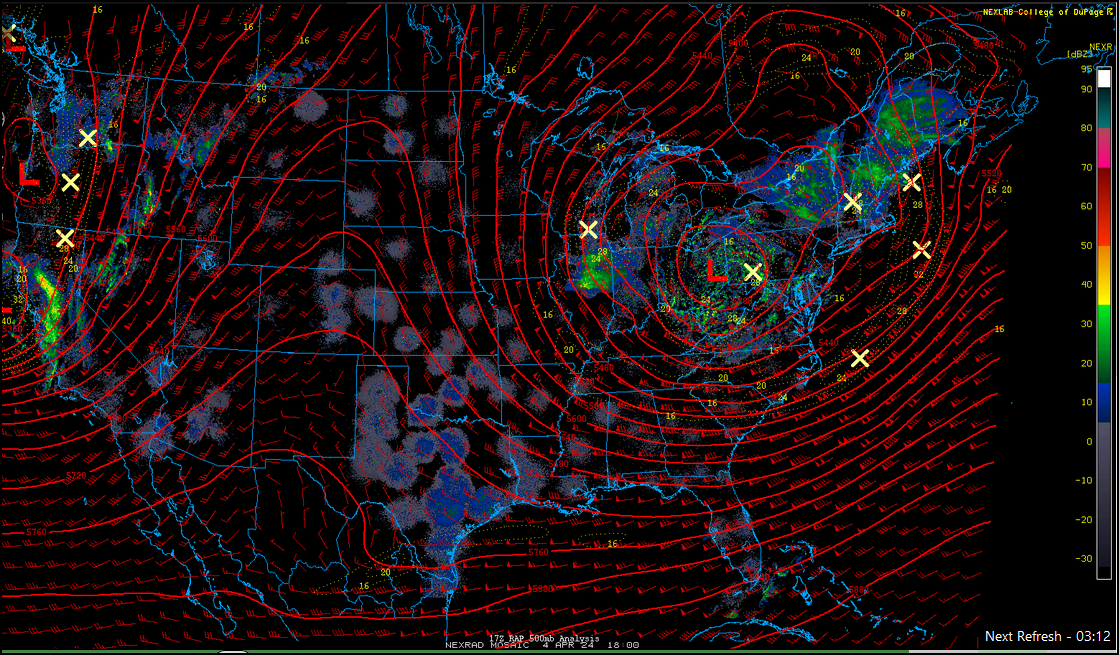
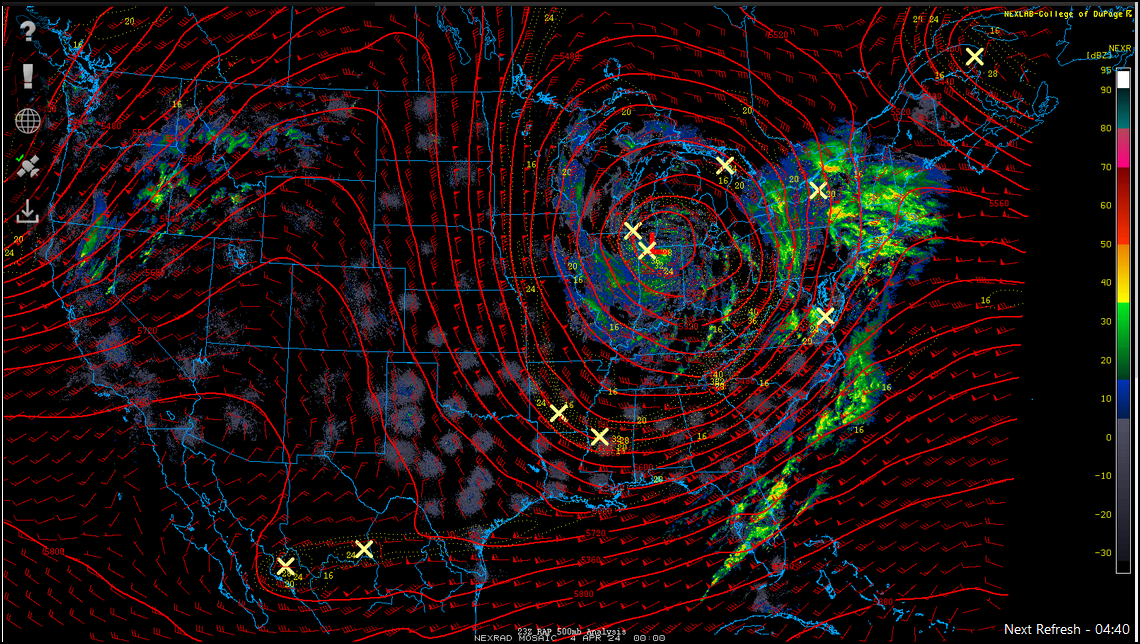
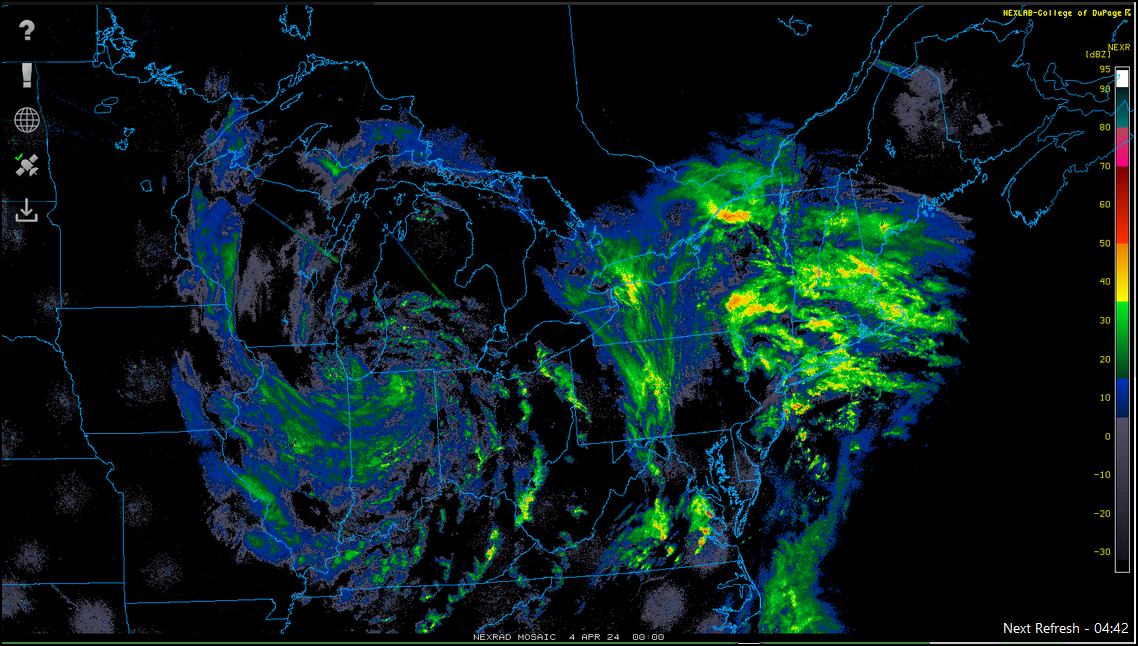
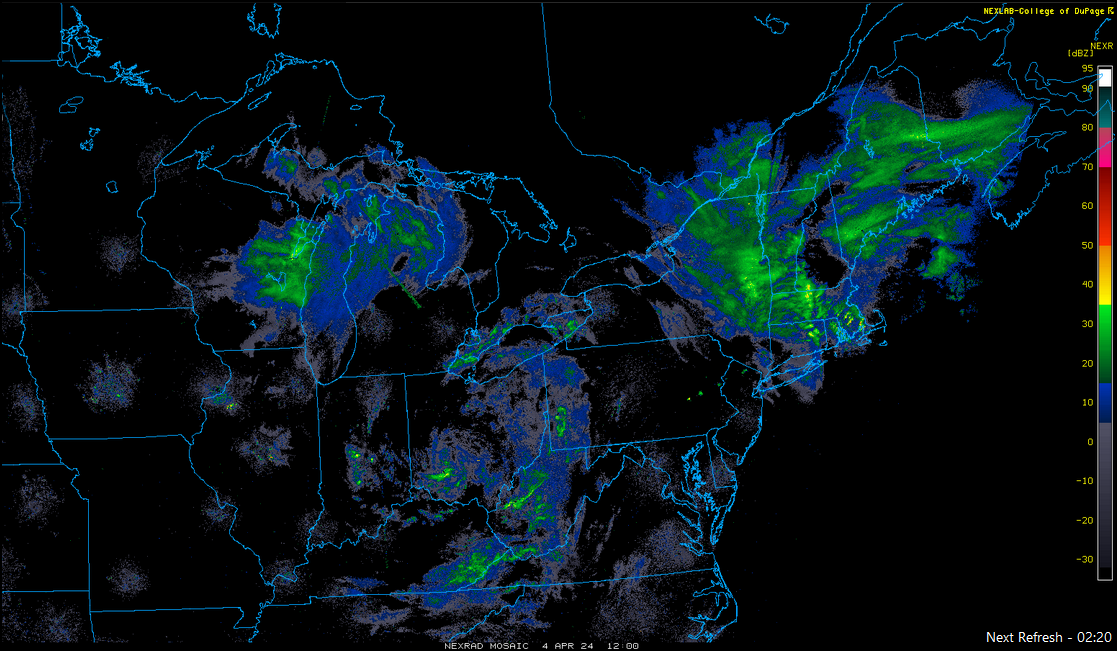
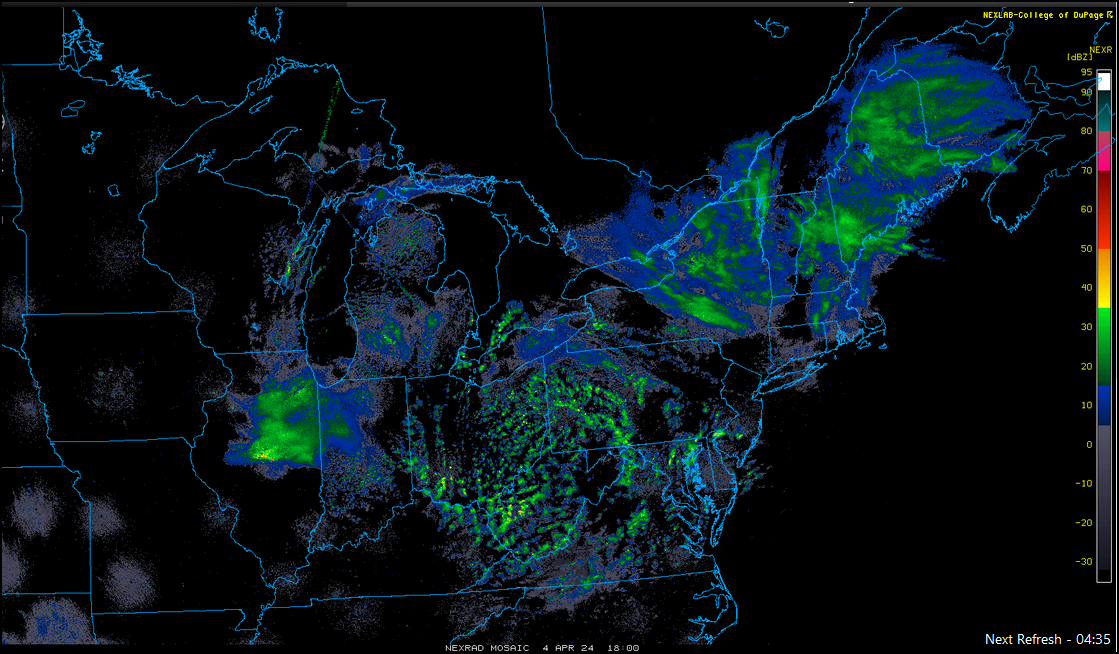
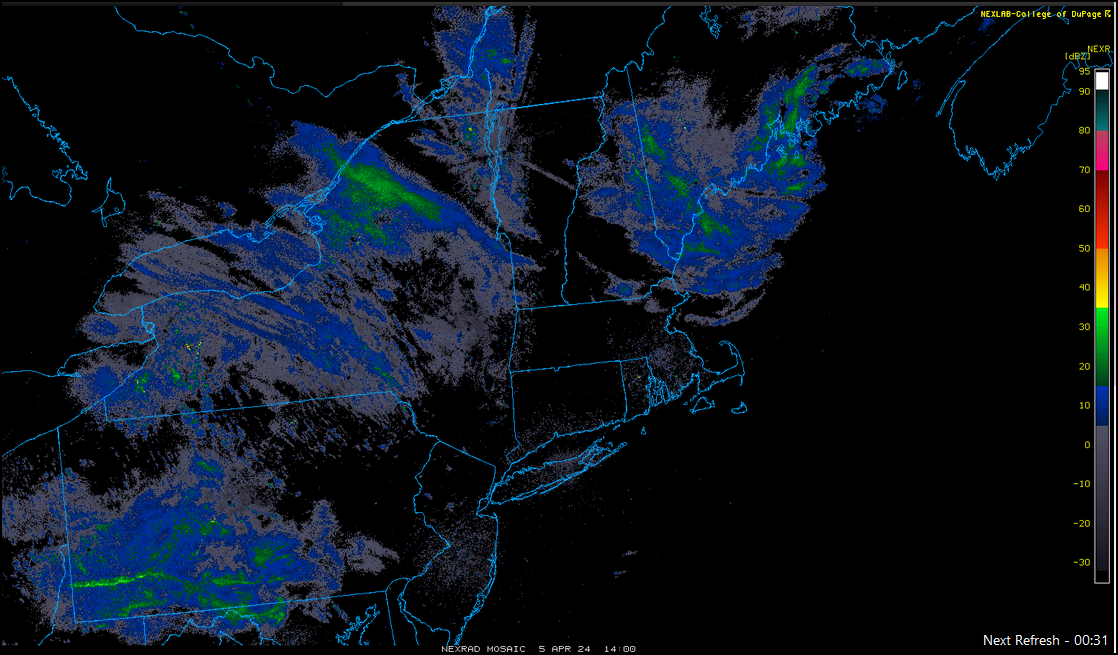
Radar imagery courtesy College of DuPage NEXLAB