Complete Results @ http://www.newx-forecasts.com/
Follow the left-panel link from '24th Annual Snow Storm Contest > Verified Forecasts > ‘Storm #3’ to see the complete forecasters’ verification table by station
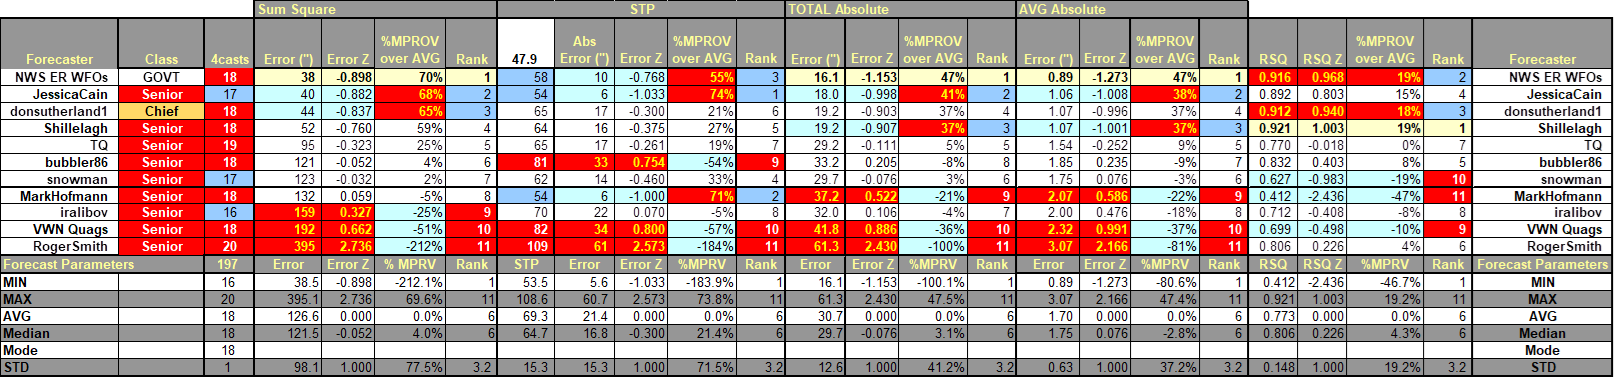
In the table ...
Yellow cells indicate the best score in category.
Forecast STP cells: yellow if within +/- 5% of observed STP.
Blue (Red) cells indicate the 25% (75%) percentile.
SUMSQ: sum of square errors (measure of forecast accuracy accounting for magnitude and distribution of snowfall)
STP: storm total precipitation
TAE: total absolute error
AAE: average absolute error
Final Standings - all Forecasters
---
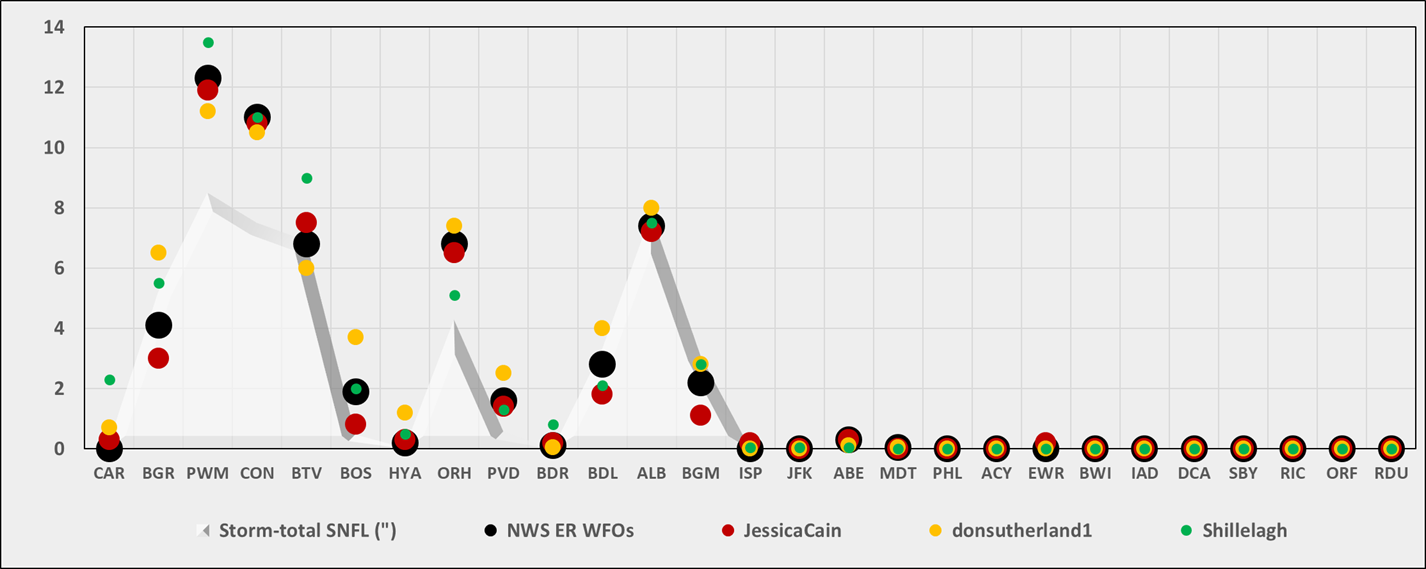
Station by Station Comparison of Top 4 Forecasts and Observed Storm-total Snowfall (STP)
---
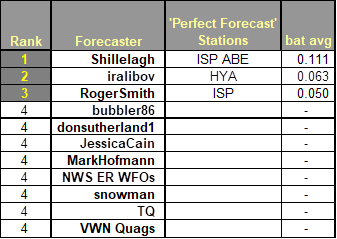
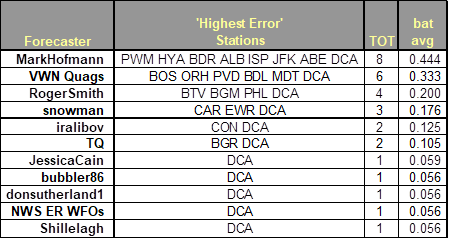
Perfect Forecasts (Batting Average - Forecast Stations with No Error)
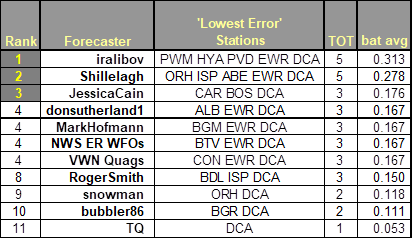
Best Station Forecasts (Batting Average - Forecast Stations with Lowest Absolute Error)
Best Station Forecast Busts (Batting Average - Forecast Stations with Highest Absolute Error)
Skill v. ER NWS WFOs
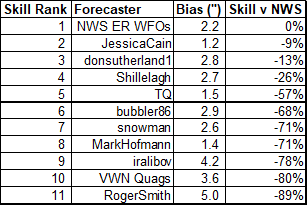
Positive skill value indicates a forecast/s improvement over the NWS forecasts.
Bias - the arithmetic difference between the average Forecast snowfall and the average Observed snowfall.
---
Consensus Forecasts … Extremes … and Observed Snowfall
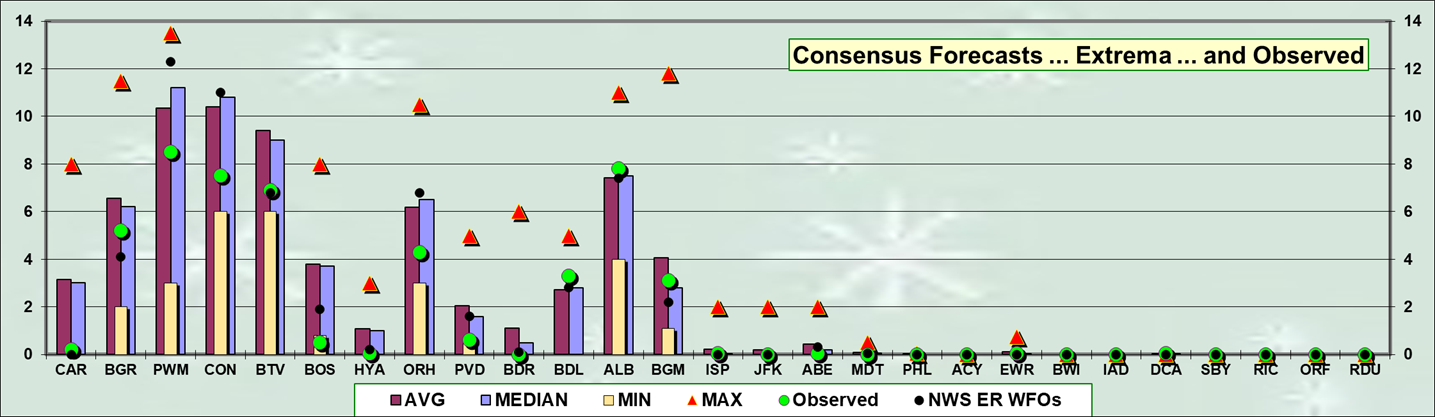
Consensus forecast best @ BDL … ALB
MAX forecast best @ none
MAX forecast less than observed @ none
MIN forecasts best @ CAR … BOS … ORH … PVD
MIN forecasts more than observed @ BOS
---
Total Absolute Error and SUMSQ Error
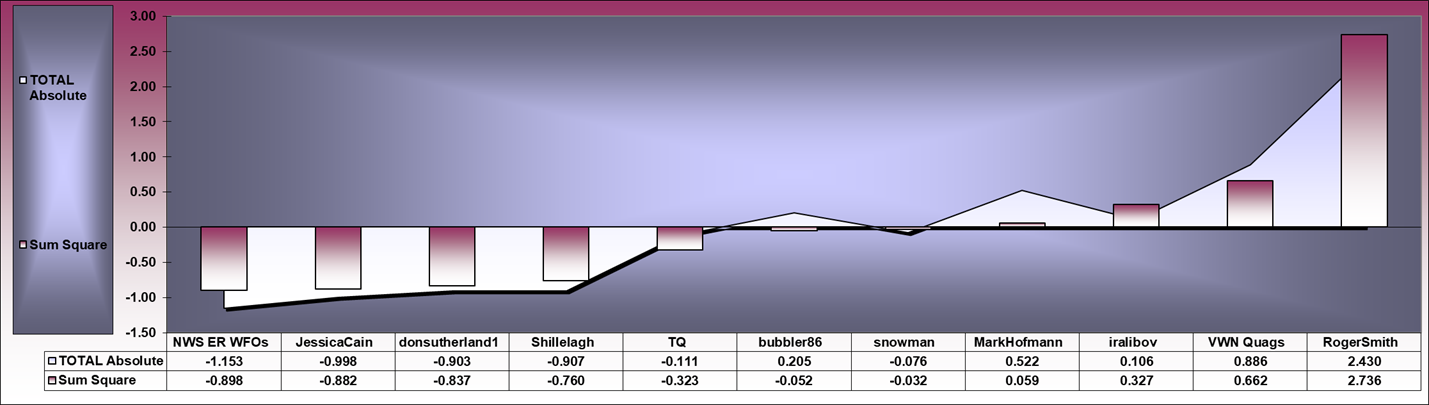
Strong correlation (R = 0.972) between SUMSQ and TAE Z-scores
---
Forecast by Observed Snowfall Scatterplots (Top 4 Forecasts)
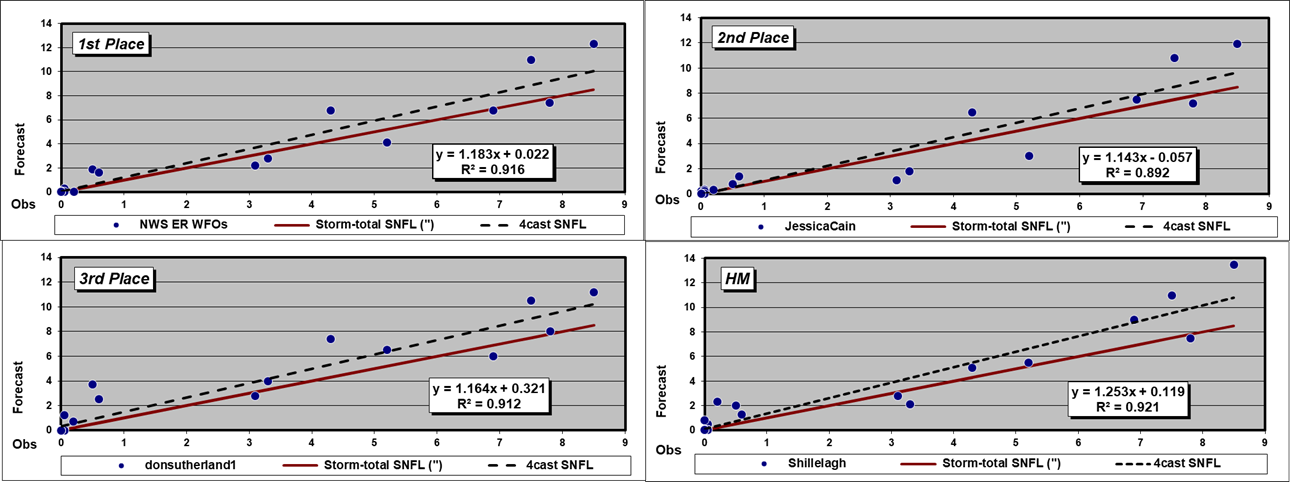
A dashed Forecast trend line above (below) solid red Observed snowfall line ==> over (under) forecast
R2 value indicates how well the forecast captured the observed snowfall’s variability … i.e., R2 = 0.874 ==> the forecast captured ~87% of the observed snowfall’s variability.
---
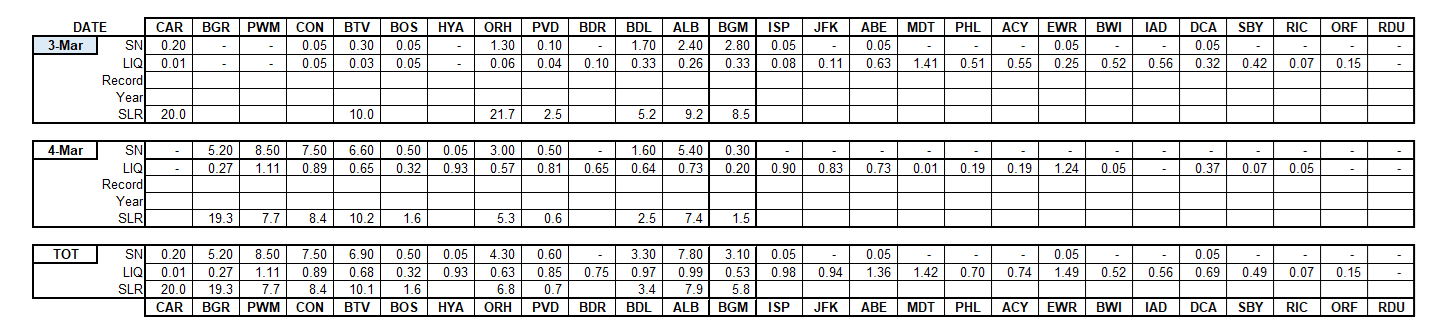
Verification of storm-total snowfalls for FRI and SAT based
on reporting found in CDUS41 (CLI) ... CXUS51 (CF6) ... METARs ... and PNS bulletins
issued by NWS.
Excellent coverage and reporting.
HYA
Trace retrieved from 041856z METAR
KHYA 041856Z 01021G33KT 3SM RA BR OVC008 03/02 A2938 RMK AO2 PK WND 01036/1838 RAE08B52SNB08E37 PRESRR SLP951 P0001 T00280022
---
Snow-to-Liquid Ratios (SLR) of less than 8:1 are unreported for stations where liquid
and / or freezing precipitation also occurred during the verification period.
---
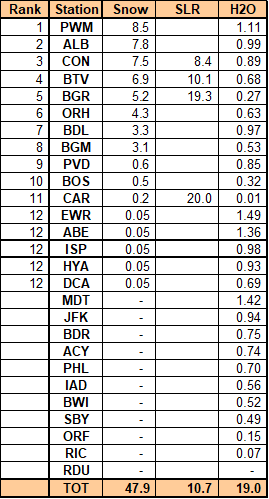
Stations observing >= Trace: 16 (59%)
Stations observing > Trace: 11 (41%)
Given a station had measurable snowfall; stations observing at least:
4" - 6 (22%)
6" - 4 (15%)
8" - 1 (4%)
MAX snow melt-water (minimum SLR 8:1)
CON - 0.89"
BTV - 0.68"
BGR - 0.27"
MAX precipitation (frozen + freezing + liquid)
EWR - 1.49"
MDT - 1.42"
ABE - 1.36
New daily snowfall record(s)
None
---
Orange cells indicate new daily record.
Trace amounts (0.05") not included in STP.
---
Approximate areal distribution of storm-total snowfall courtesy NOHRSC
---
SFC analysis: 12z ... 04-MAR-23 and Storm-total Snowfall by Station
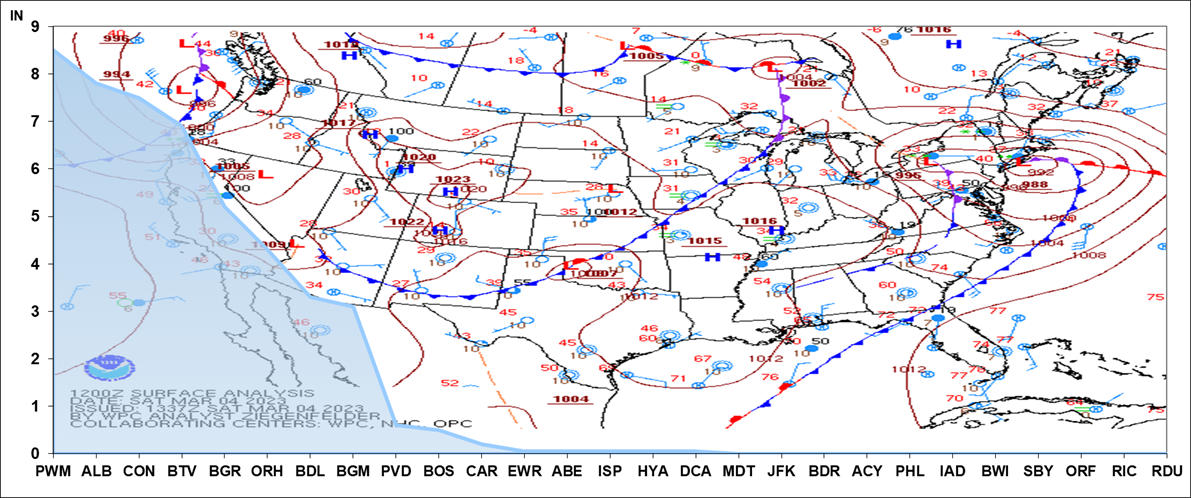
Images courtesy DOC / NOAA / NWS / NCEP / WPC
https://www.wpc.ncep.noaa.gov/html/avnsfc.shtml
---
Teleconnections
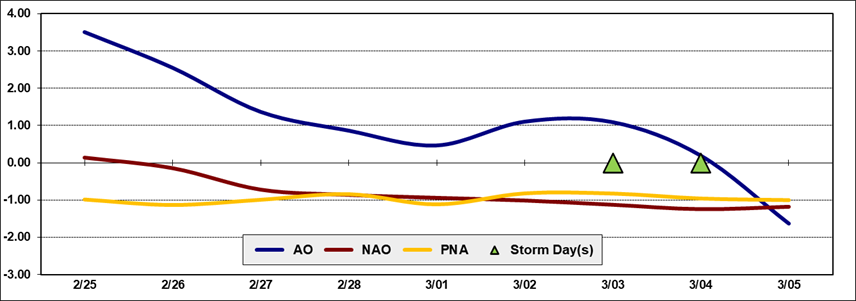
Teleconnection time-series data courtesy CPC
---
Upper Air
Upper air charts courtesy University of WY
---
SFC analysis
Images courtesy DOC / NOAA / NWS / NCEP / WPC
https://www.wpc.ncep.noaa.gov/html/avnsfc.shtml
---
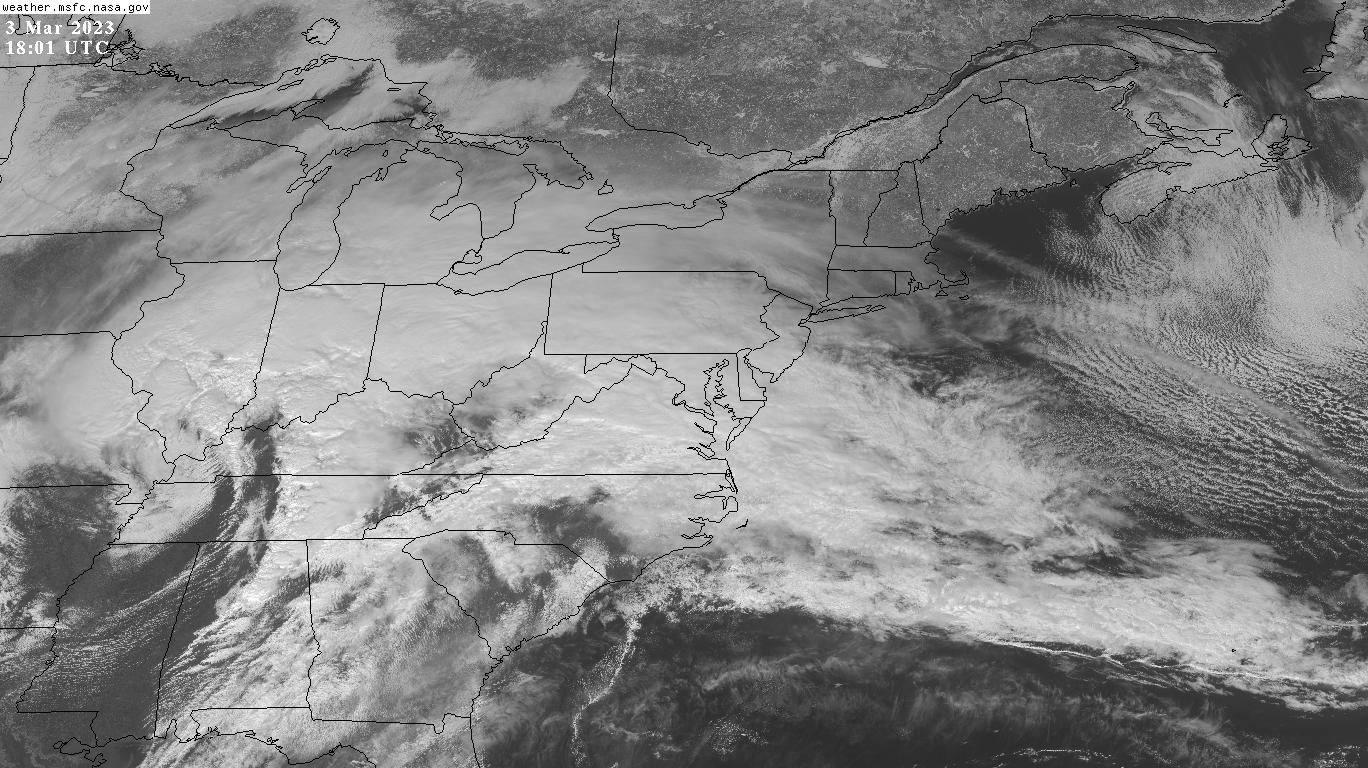
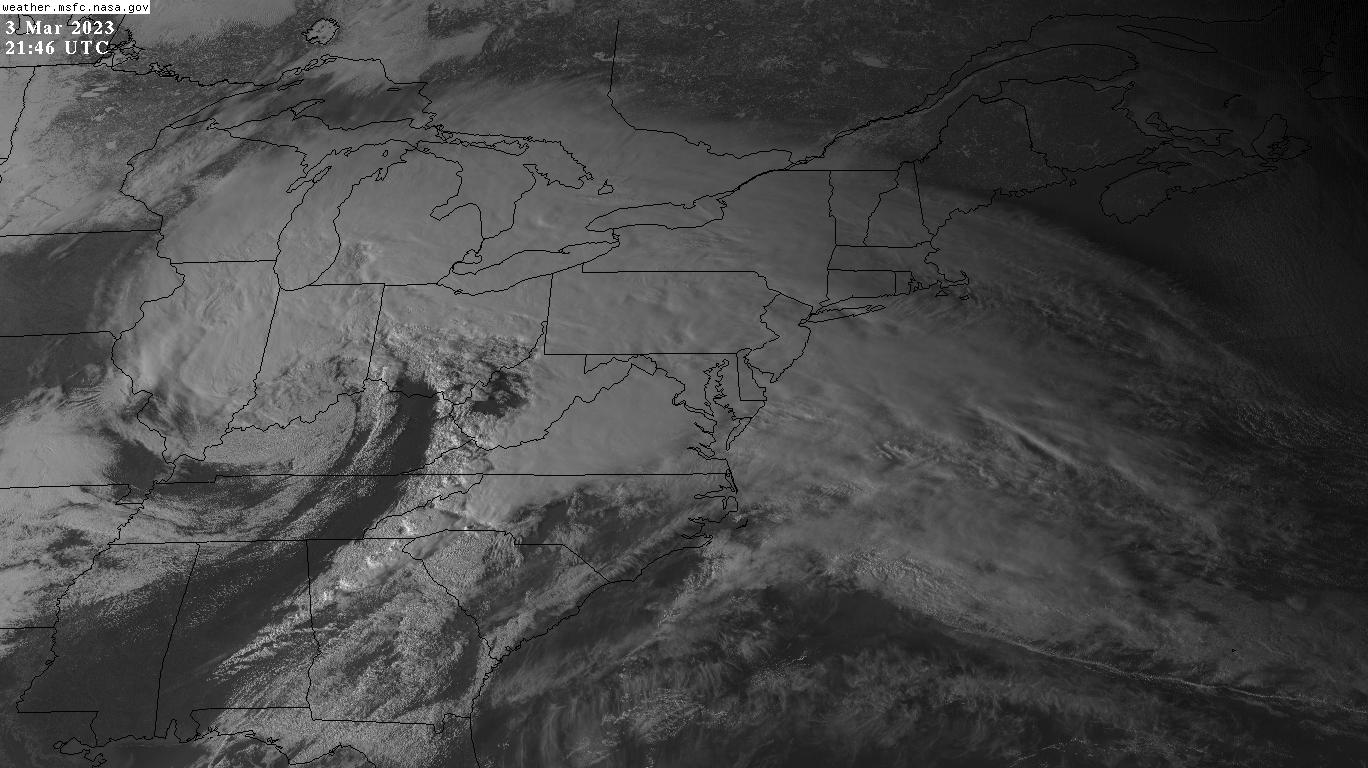
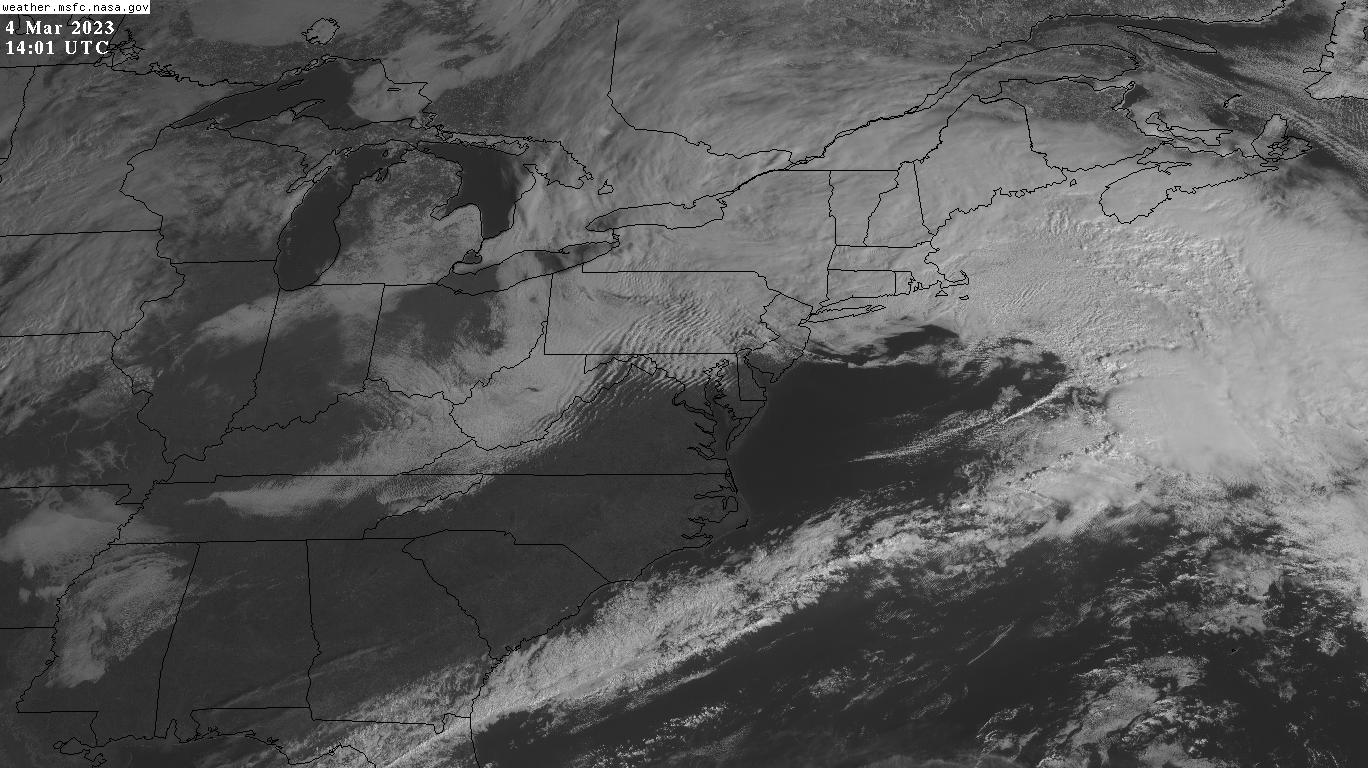
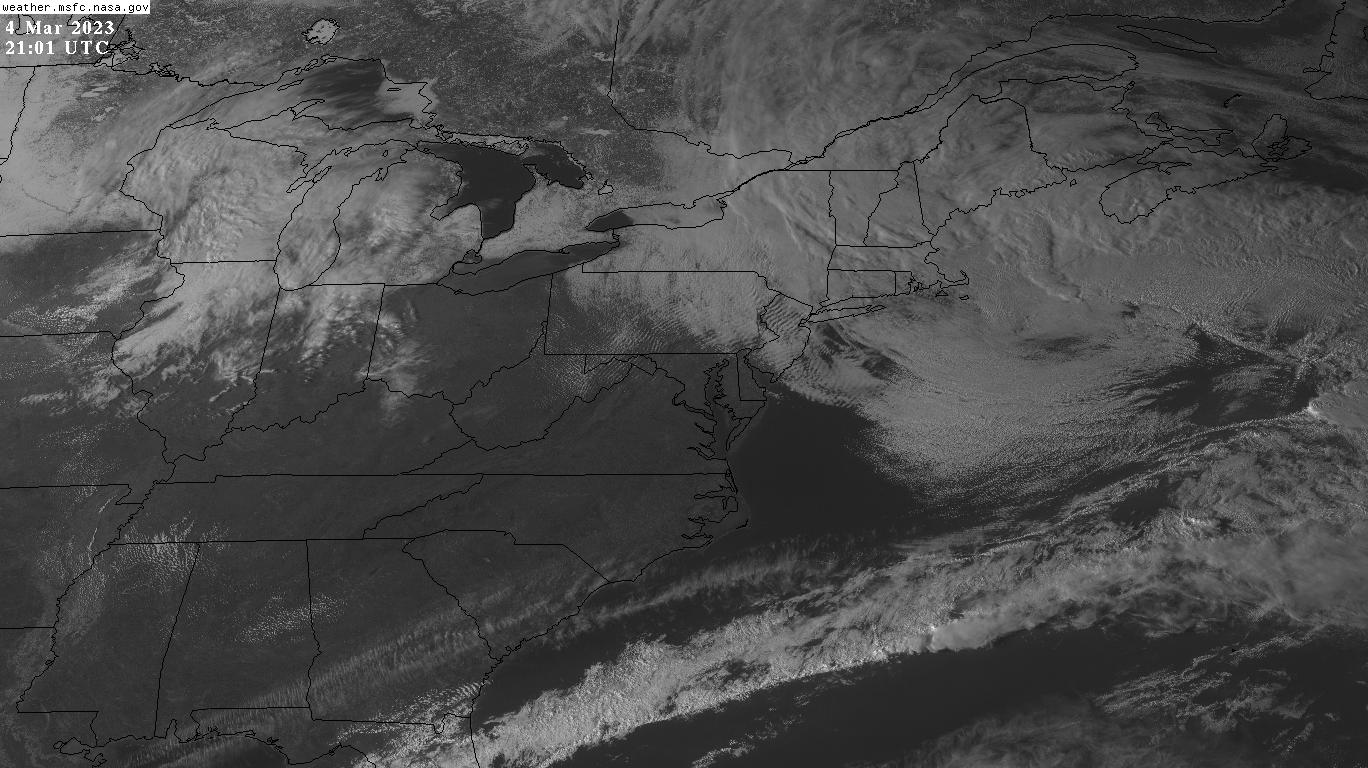
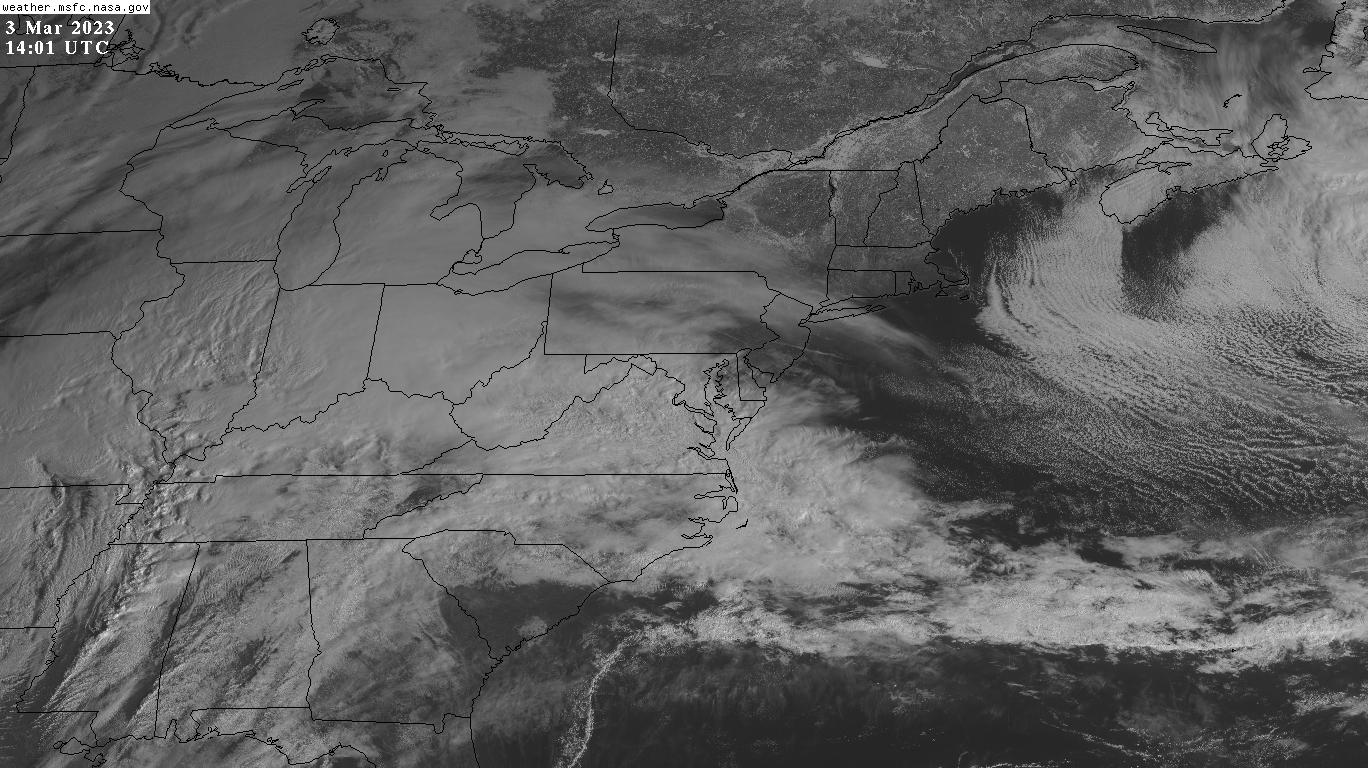
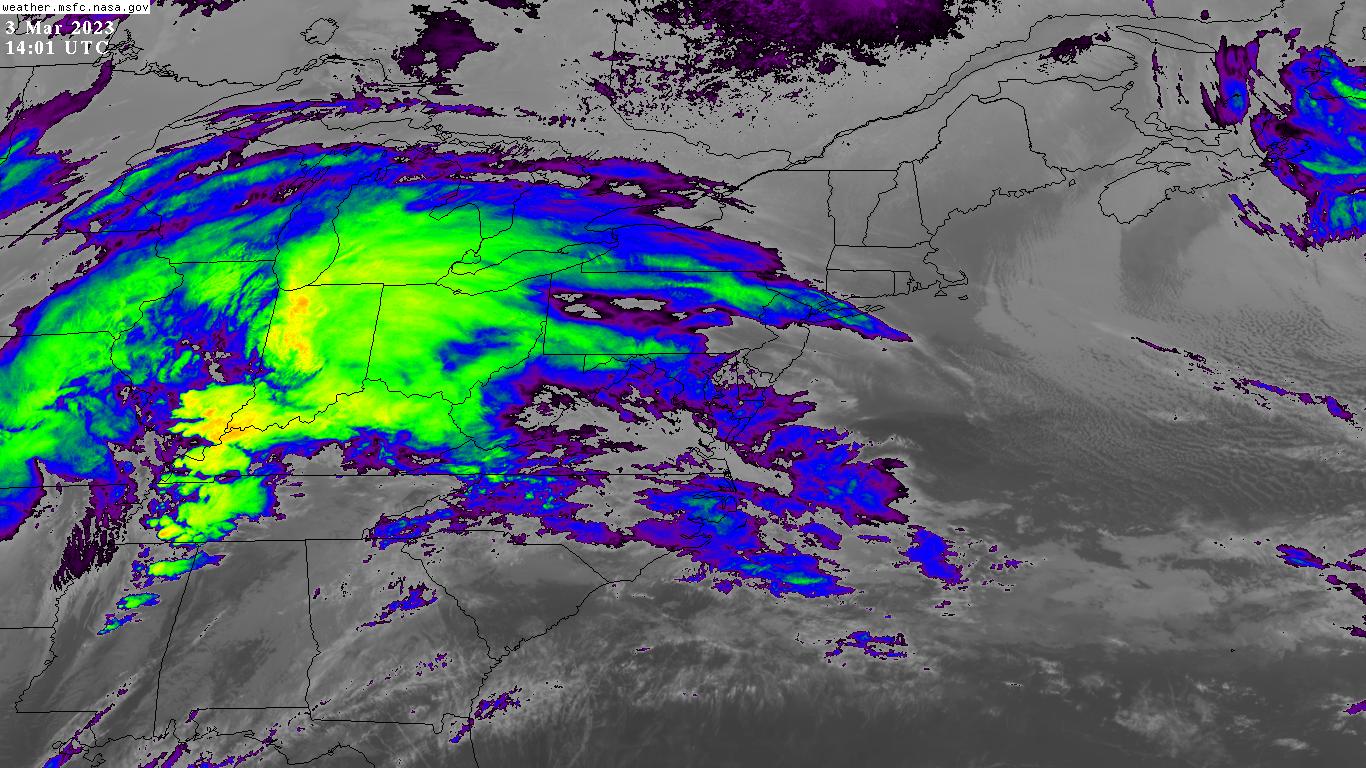
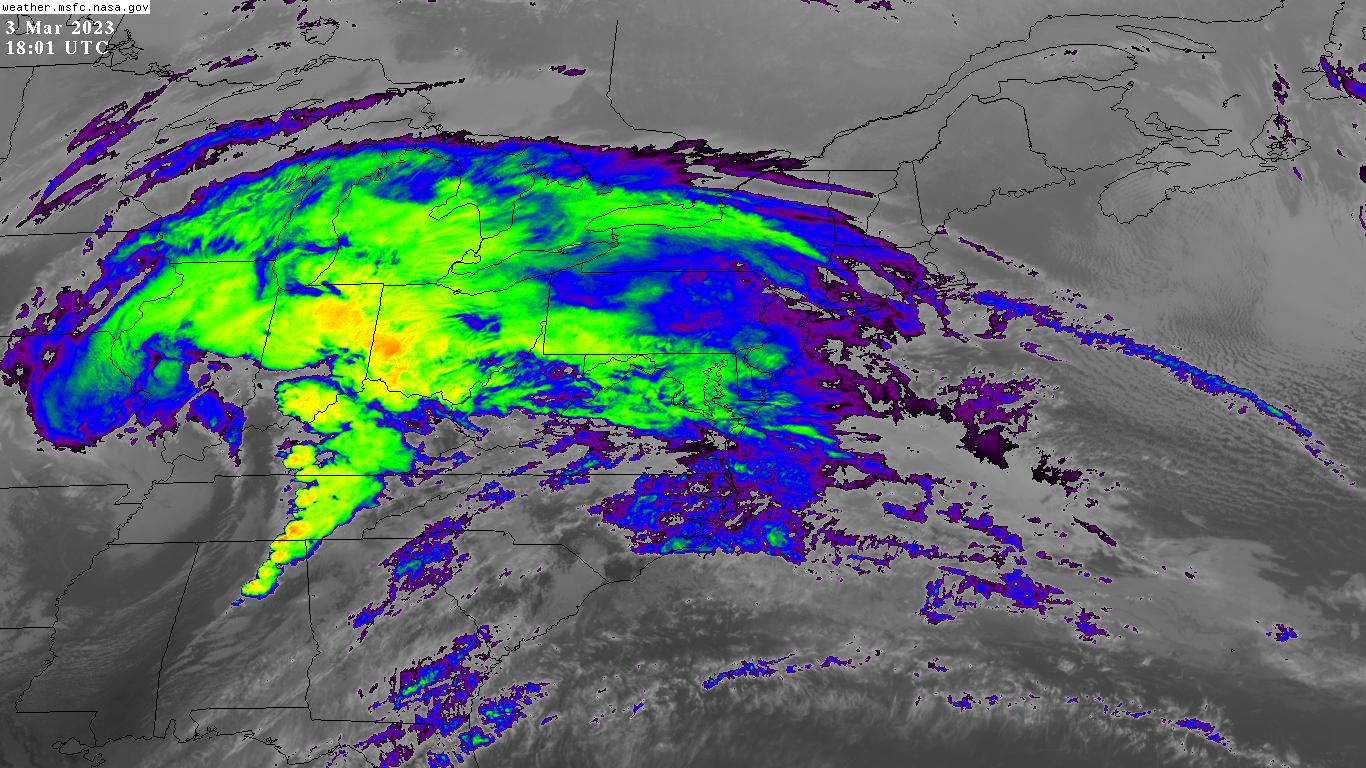
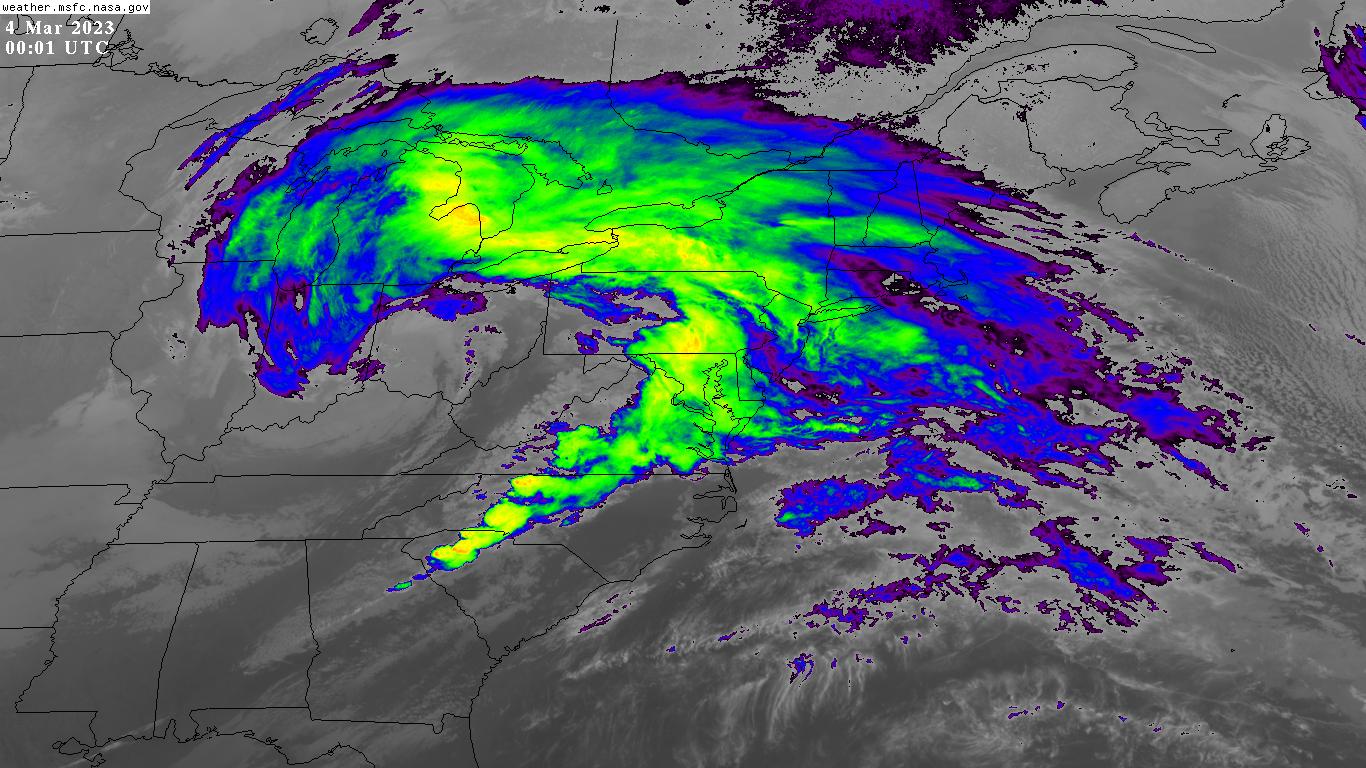
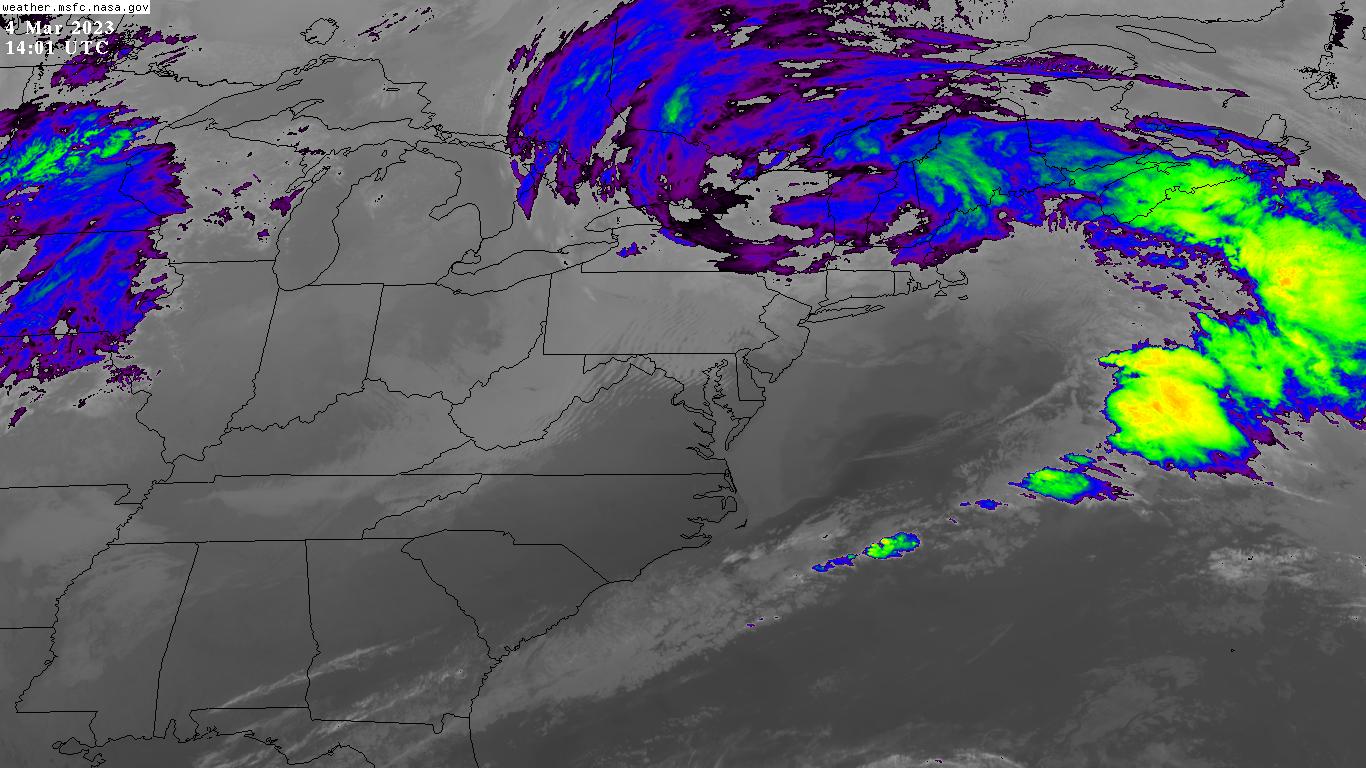
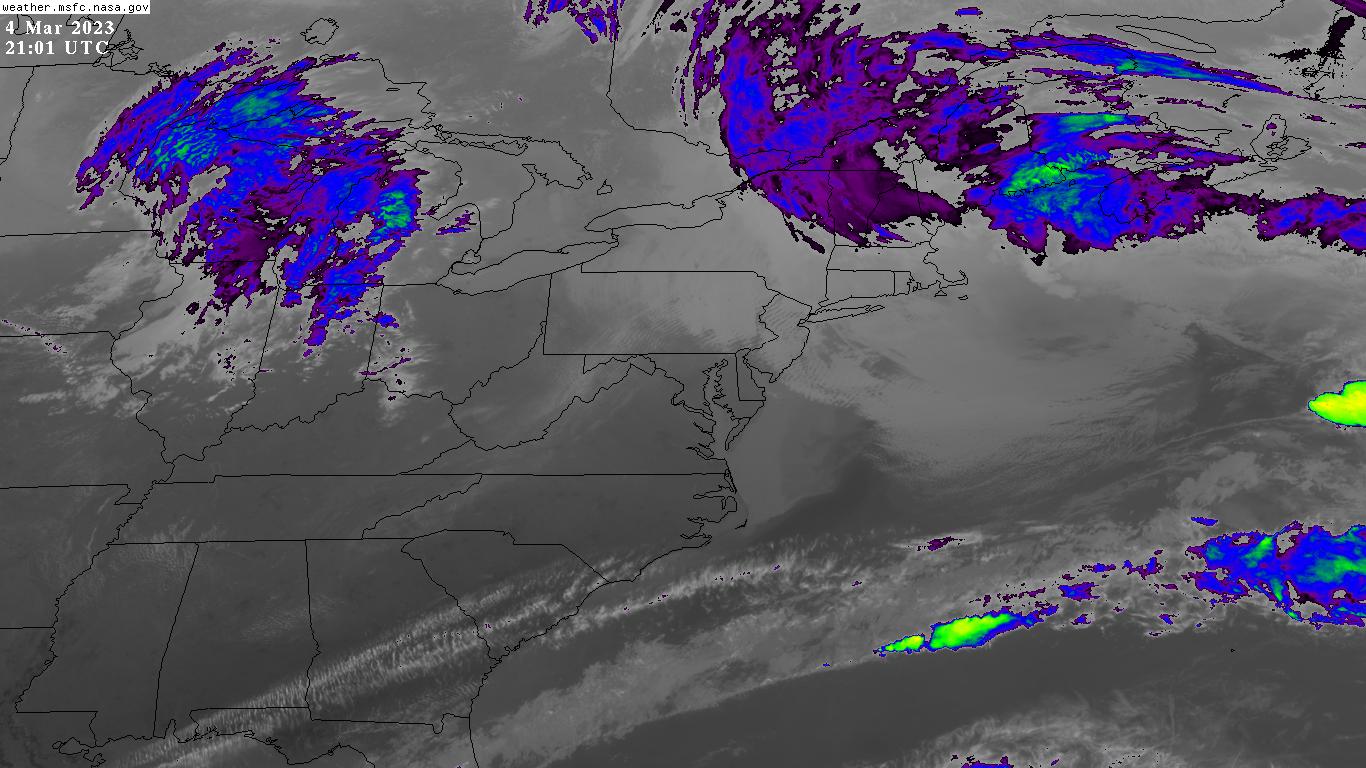
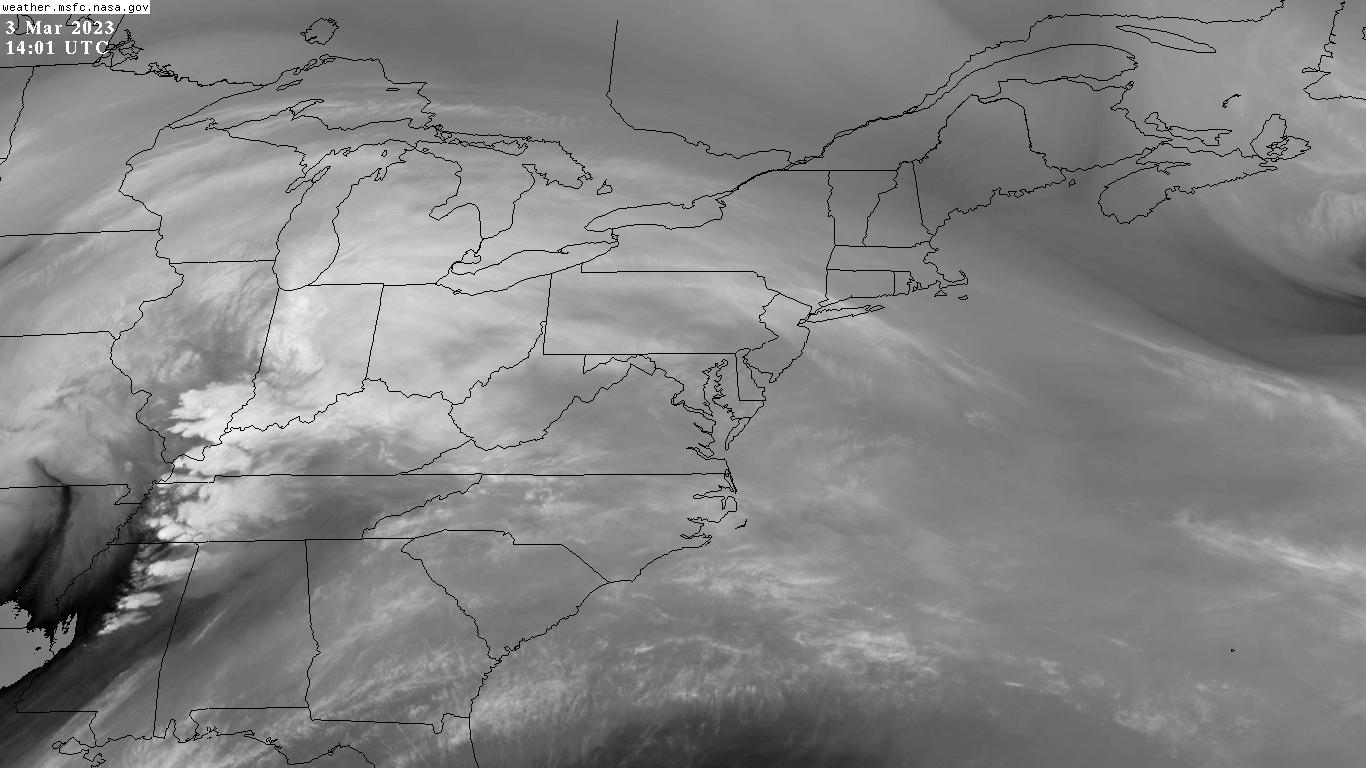
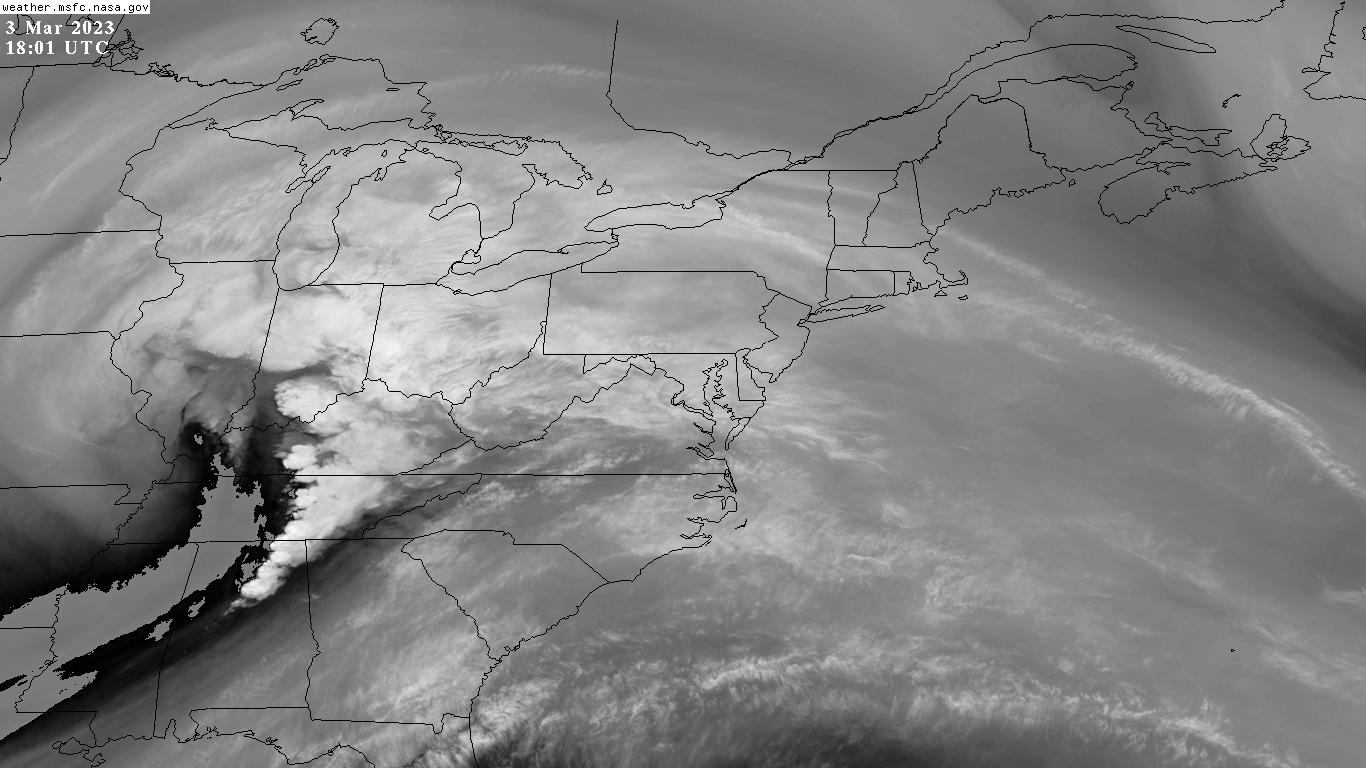
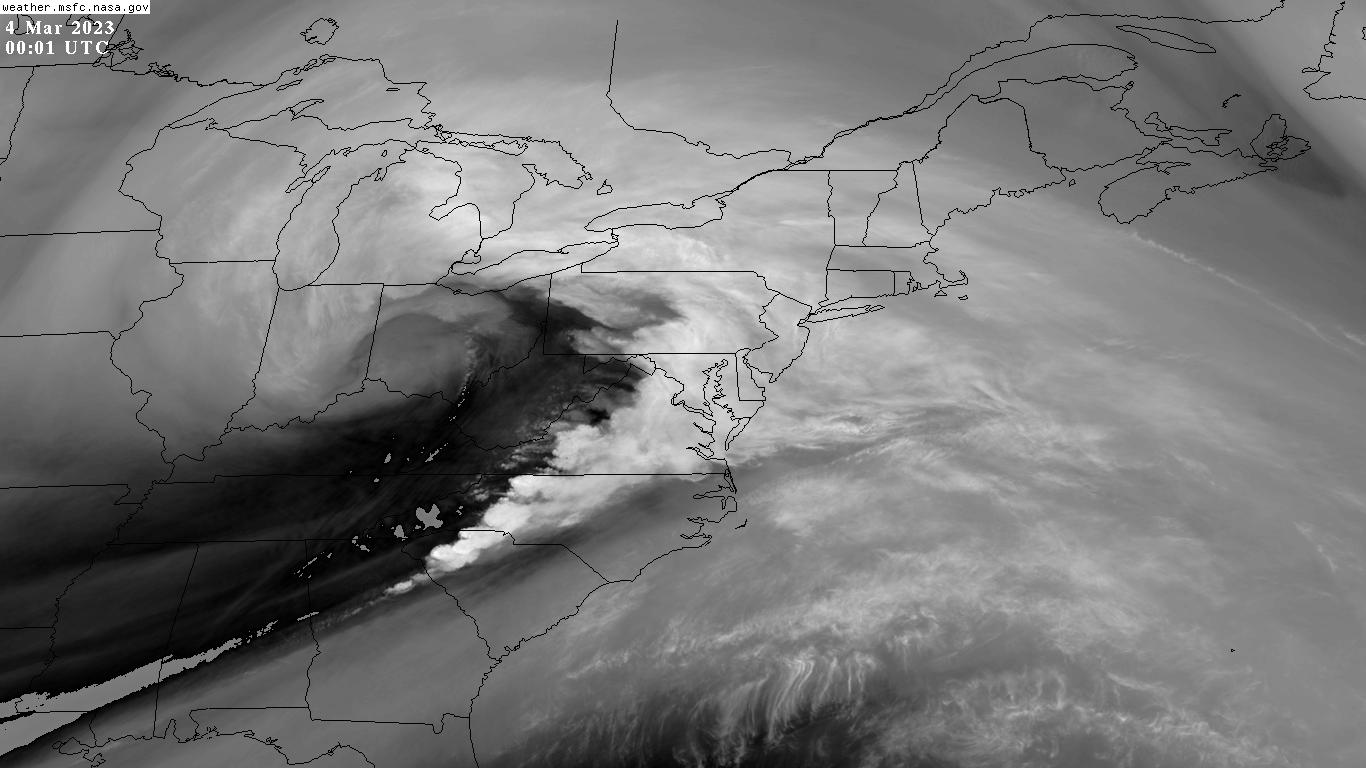
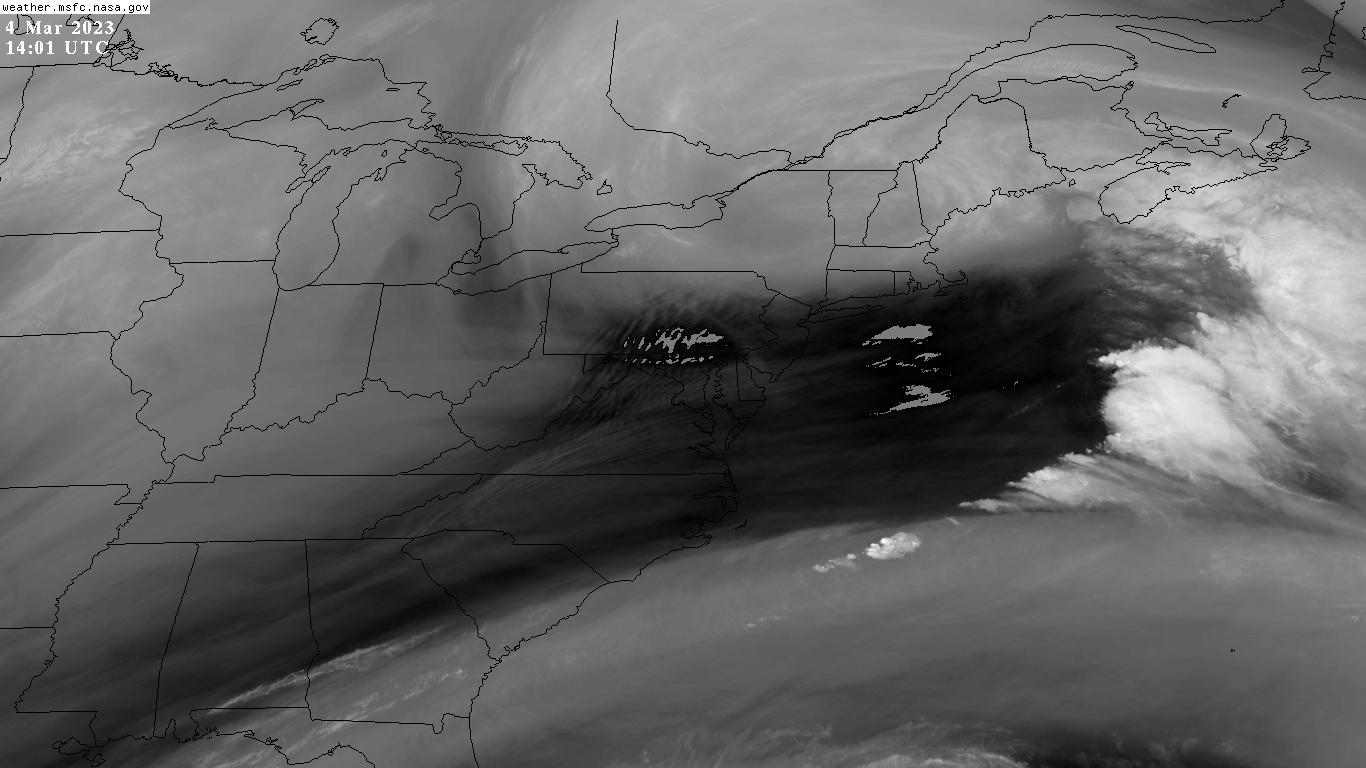
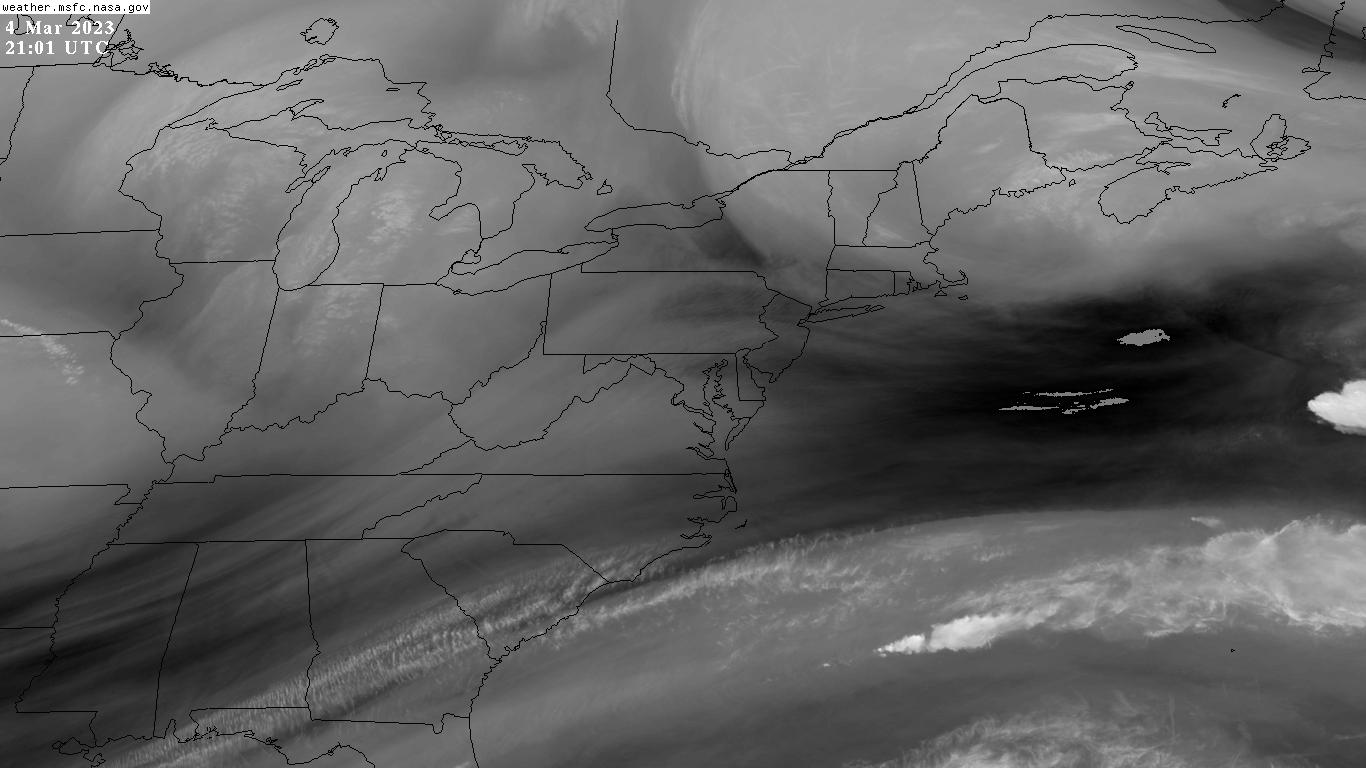
Satellite imagery courtesy George C. Marshall Space Flight Center Earth Science Branch
---
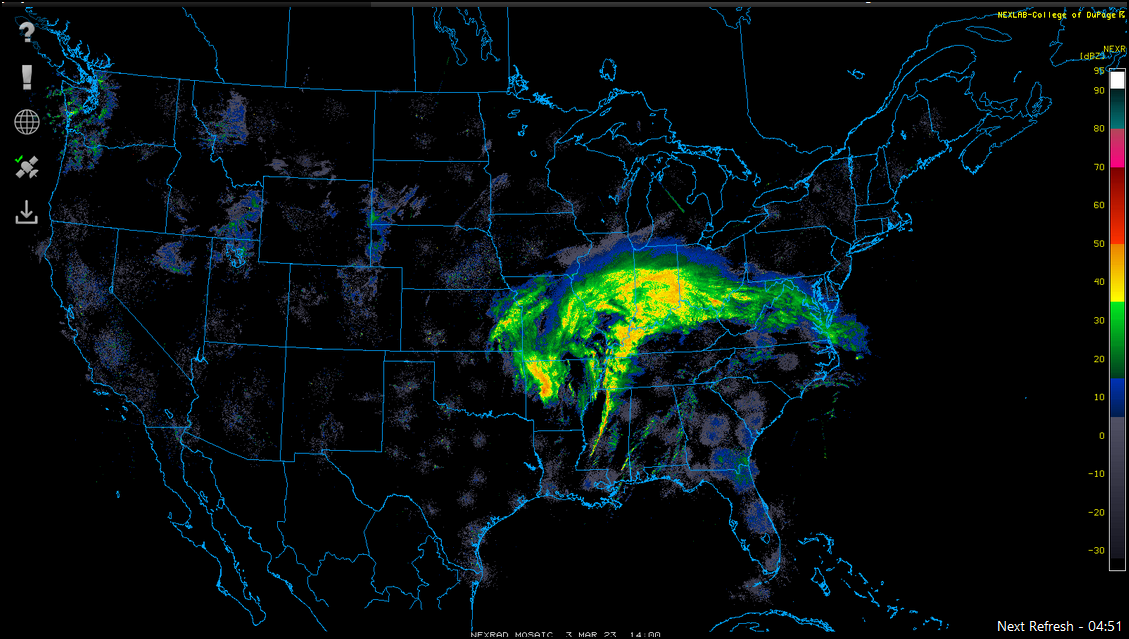
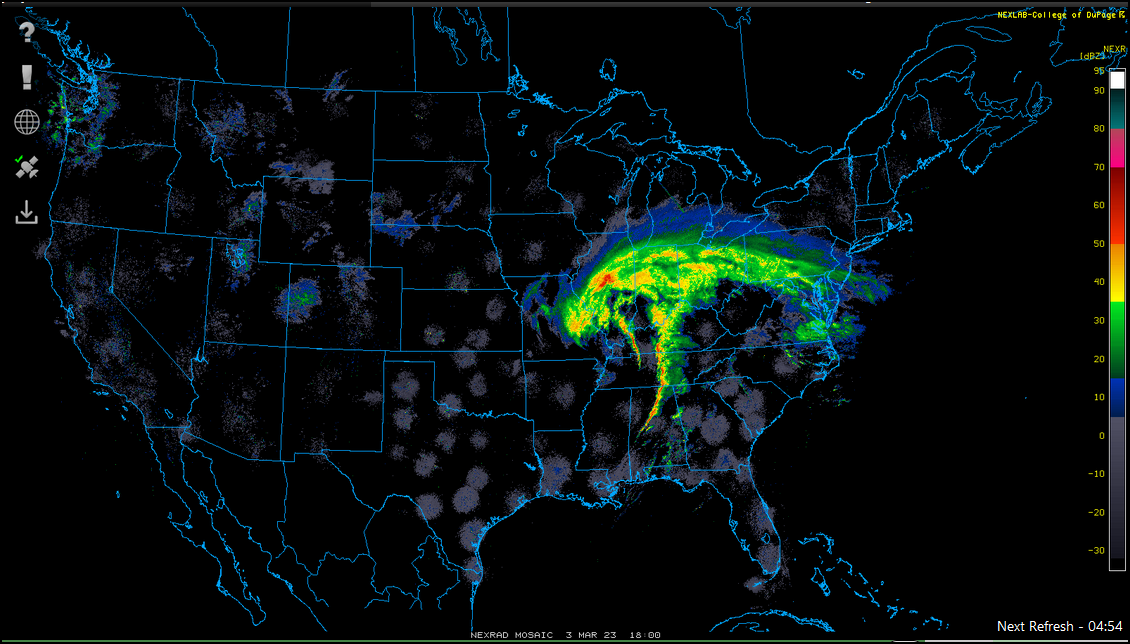
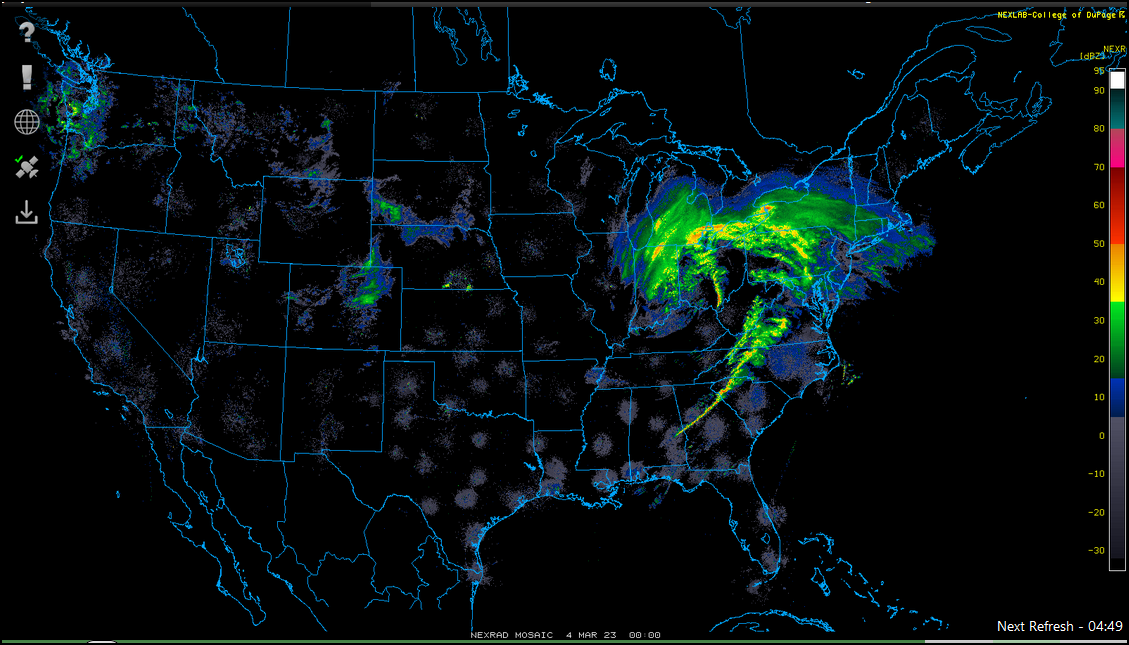
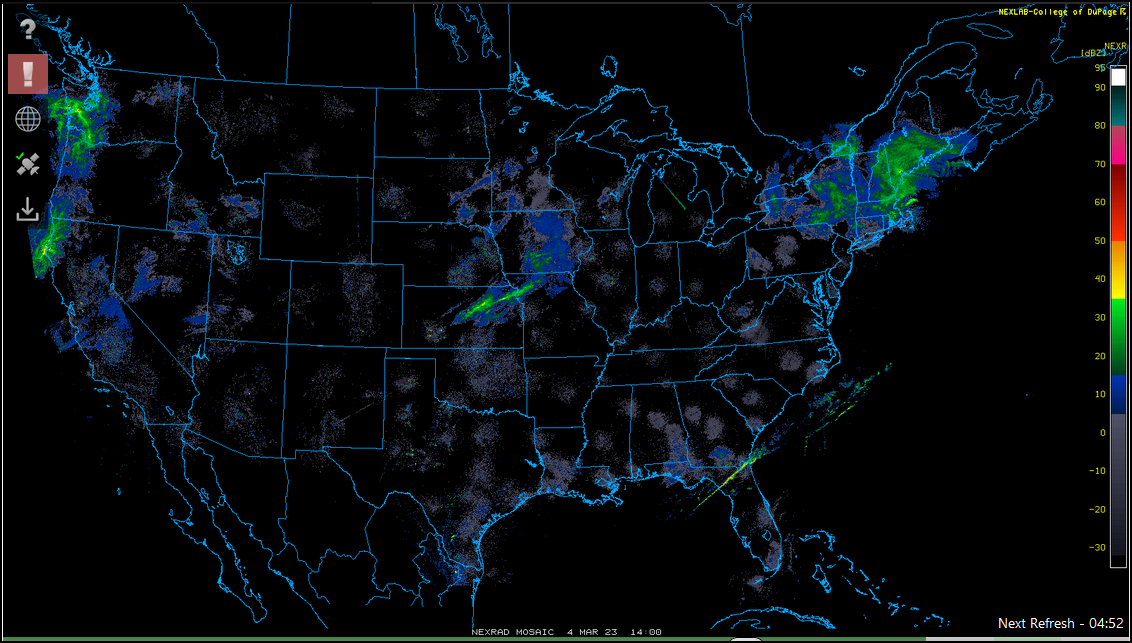
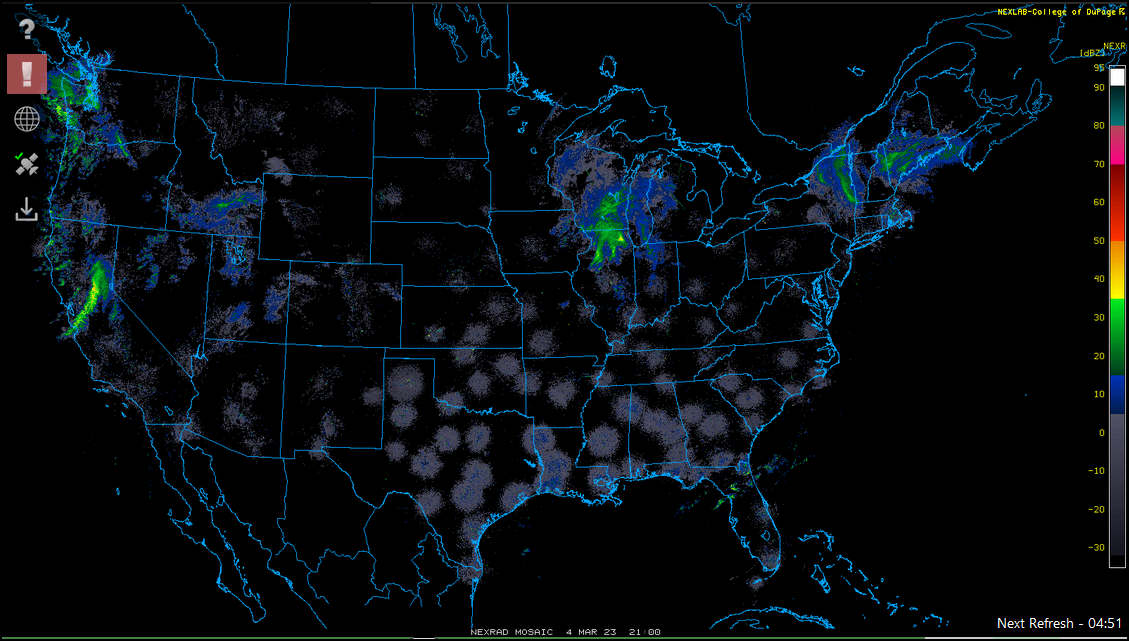
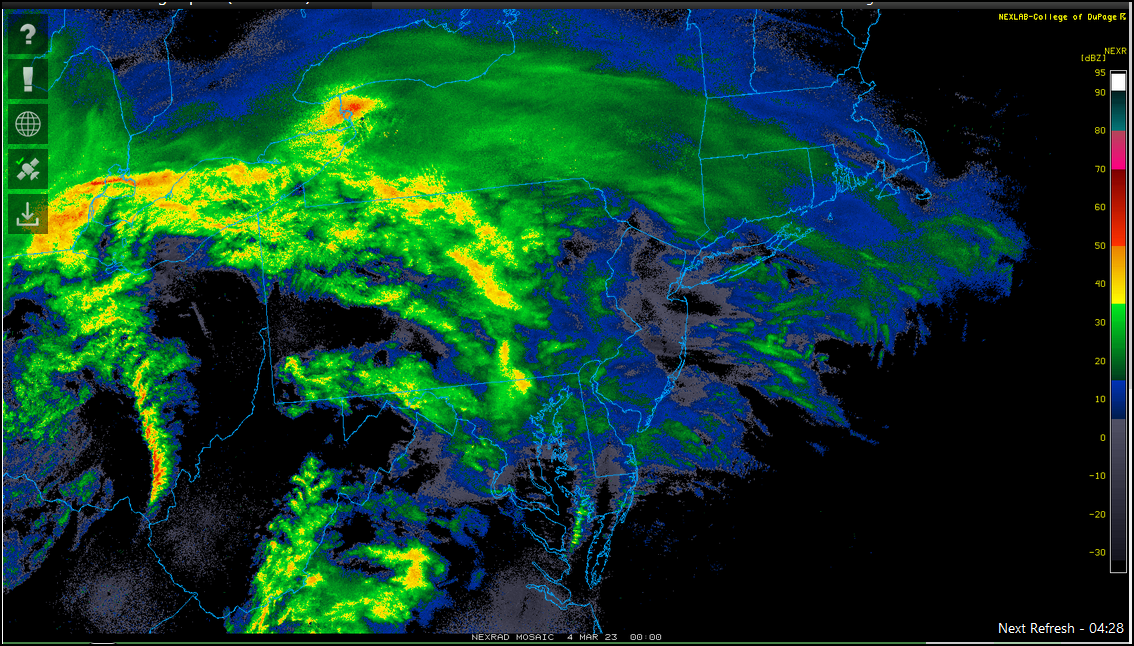
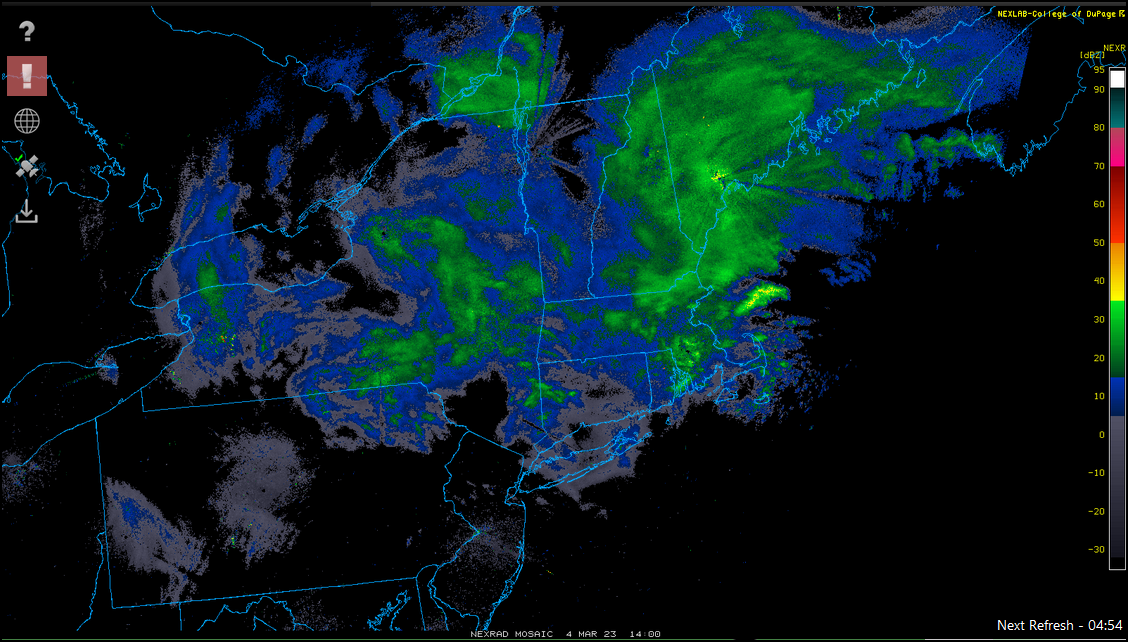
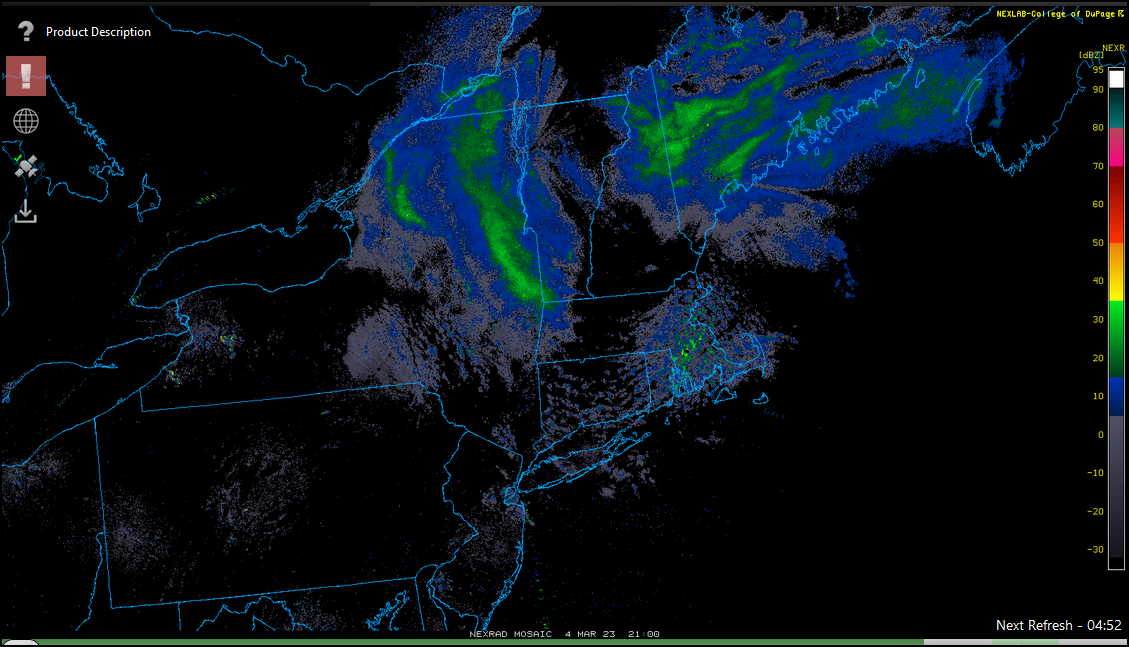
Radar imagery courtesy College of DuPage NEXLAB