Complete Results @ http://www.newx-forecasts.com/
Follow the left-panel link from '23nd Annual Snow Storm Contest > Verified Forecasts > ‘Storm #5’ to see the complete forecasters’ verification table by station
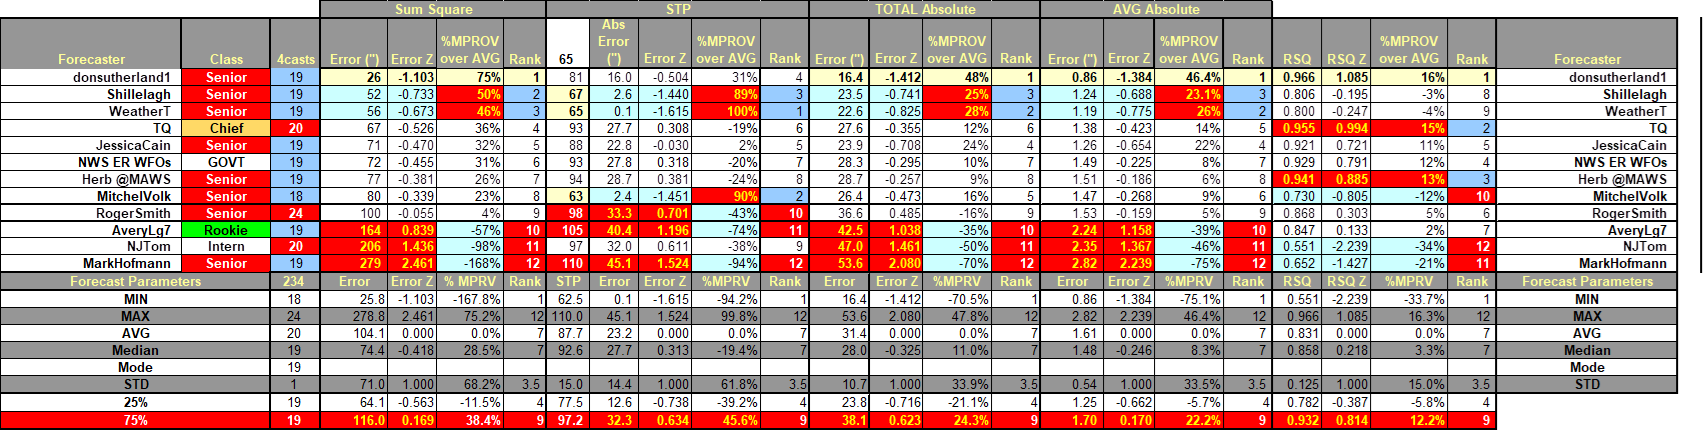
In the table ...
Yellow cells indicate the best score in category.
Forecast STP cells: yellow if within +/- 5% of observed STP.
Blue (Red) cells indicate the 25% (75%) percentile.
SUMSQ: sum of square errors (measure of forecast accuracy accounting for magnitude and distribution of snowfall)
STP: storm total precipitation
TAE: total absolute error
AAE: average absolute error
Final Standings - all Forecasters
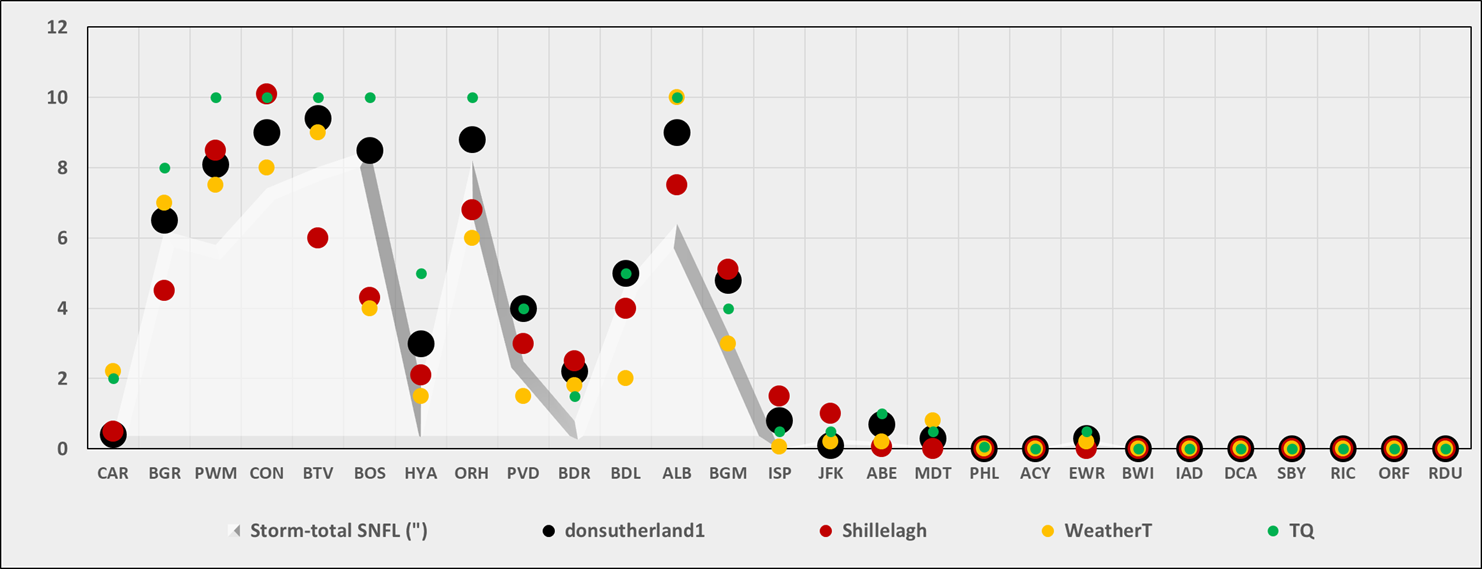
Station by Station Comparison of Top 4 Forecasts and Observed Storm-total Snowfall (STP)
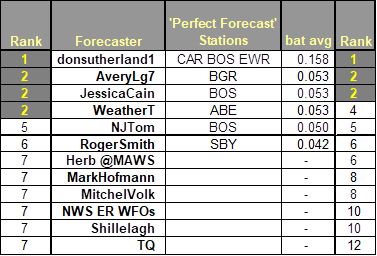
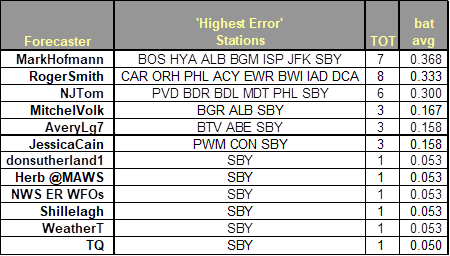
Perfect Forecasts (Batting Average - Forecast Stations with No Error)
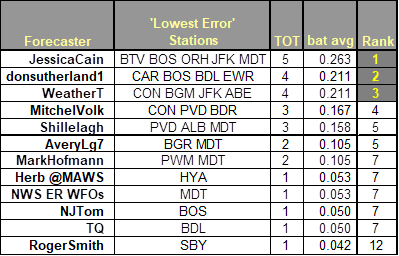
Best Station Forecasts (Batting Average - Forecast Stations with Lowest Absolute Error)
Best Station Forecast Busts (Batting Average - Forecast Stations with Highest Absolute Error)
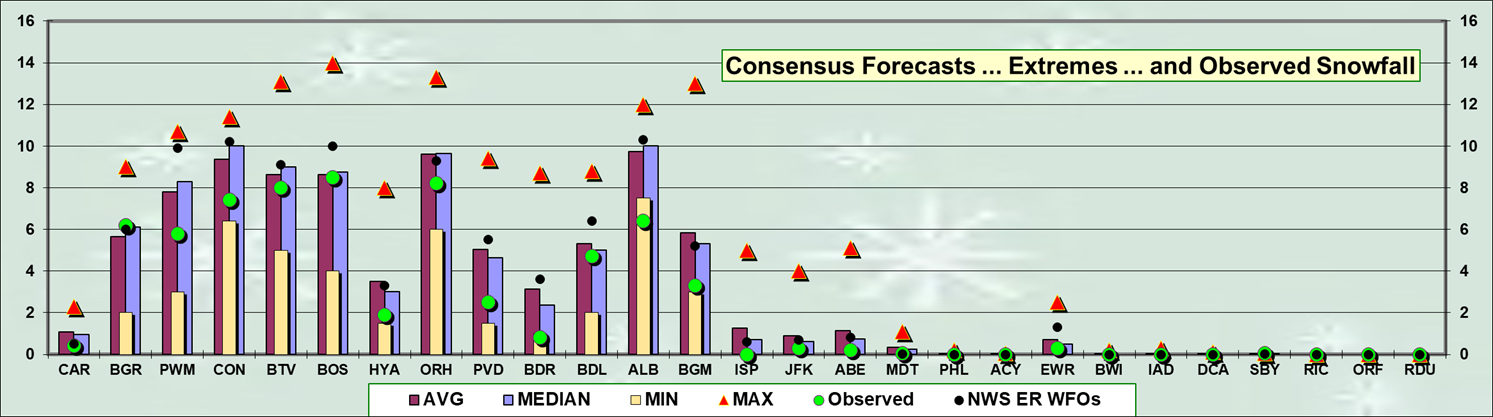
Consensus forecast best @ BGR … BOS … BDL
MAX forecast best @
MAX forecast less than observed @
MIN forecasts best @ CON …HYA …PVD …BDR … ALB … BGM
MIN forecasts more than observed @ ALB
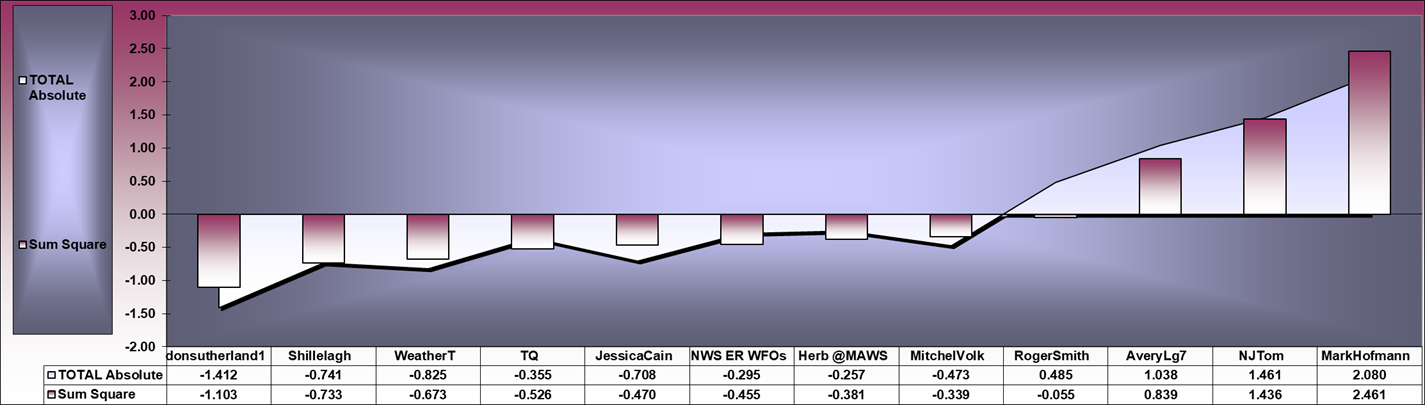
Strong correlation (R = 0.969) between SUMSQ and TAE Z-scores
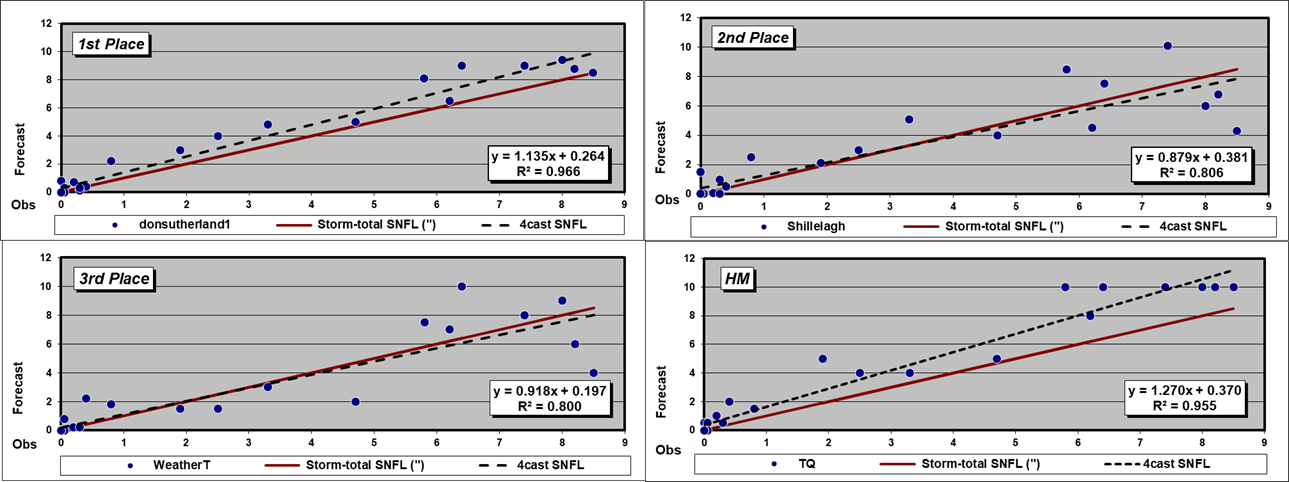
A dashed Forecast trend line above (below) solid red Observed snowfall line ==> over (under) forecast
R2 value indicates how well the forecast captured the observed snowfall’s variability … i.e., R2 = 0.874 ==> the forecast captured ~87% of the observed snowfall’s variability.
*******************************
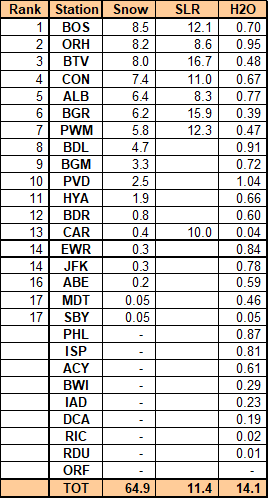
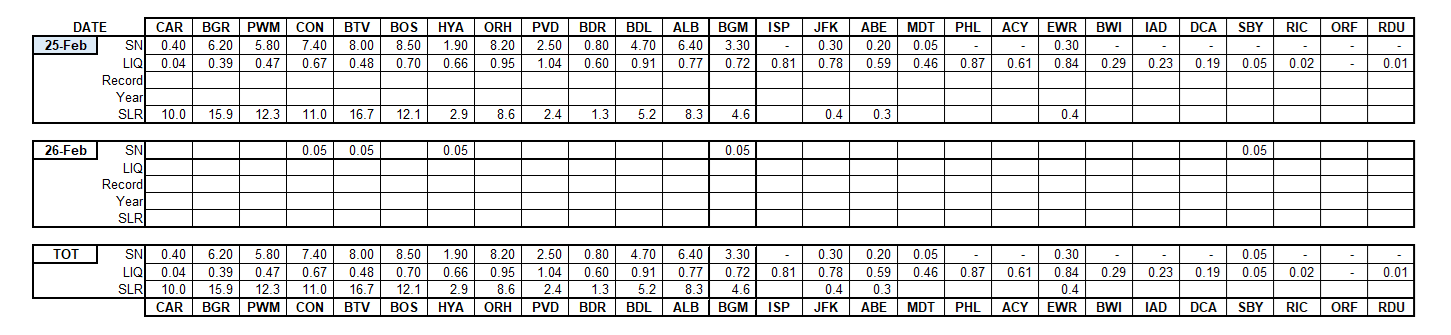
Verification of storm-total snowfalls for FRI … 25-FEB-22 from CDUS41 (CLI) ... CXUS51 (CF6) ... METARs ... and PNS bulletins. Excellent coverage and reporting.
HYA
STP estimated from NOHRSC reports using inverse distance weighting of vicinity reports within 5 miles of the station.
http://en.wikipedia.org/wiki/Inverse_distance_weighting
Trace amounts for SAT derived from METARs.
---
---
Stations observing >= Trace: 18 (67%)
Given stations had measurable snowfall ... stations observing at least:
4" - 8 (30%)
6" - 6 (22%)
8" - 3 (11%)
Max snow melt-water (minimum SLR 8:1)
ORH - 0.95"
ALB - 0.77"
BOS - 0.70"
Max precipitation (frozen + freezing + liquid):
PVD - 1.04"
ORH - 0.95"
BDL - 0.91"
New daily record(s):
none
---
Orange cells indicate new daily record.
Trace amounts (0.05") are not included in STP.
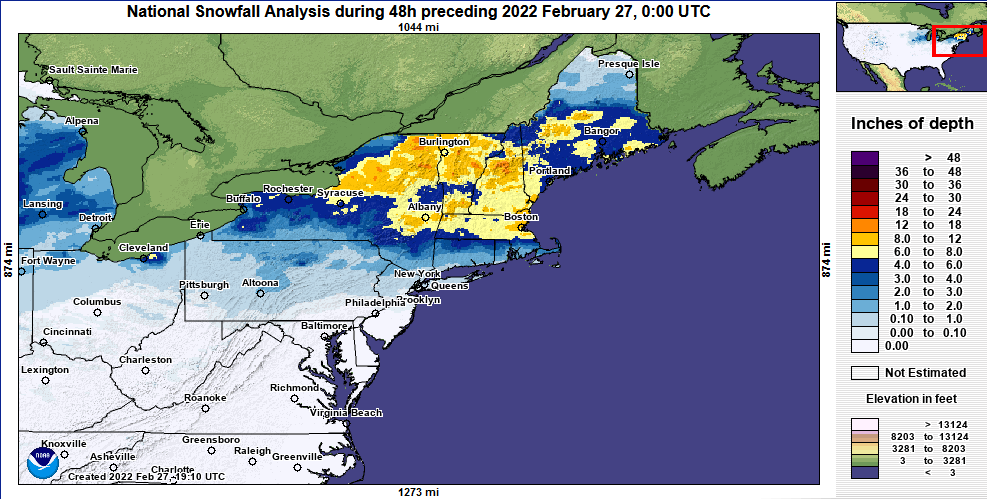
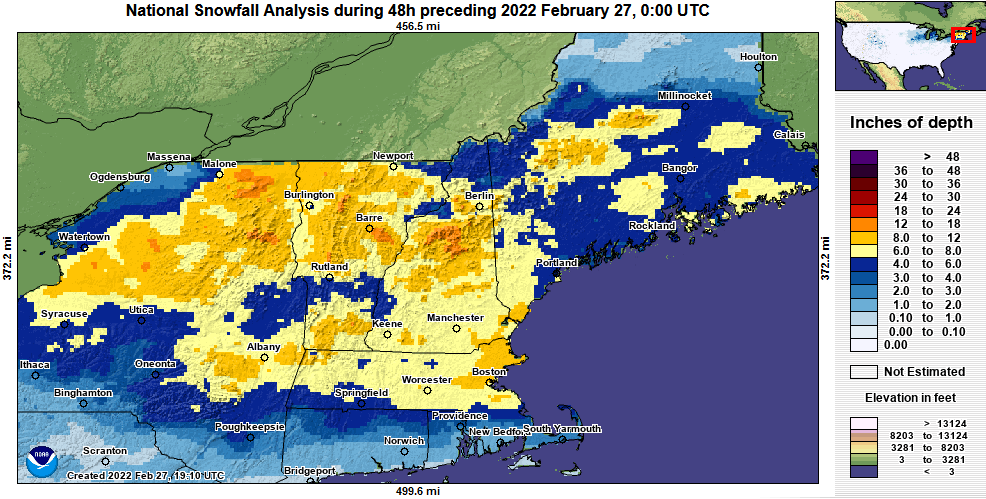
Approximate storm-total snowfall courtesy NOHRSC
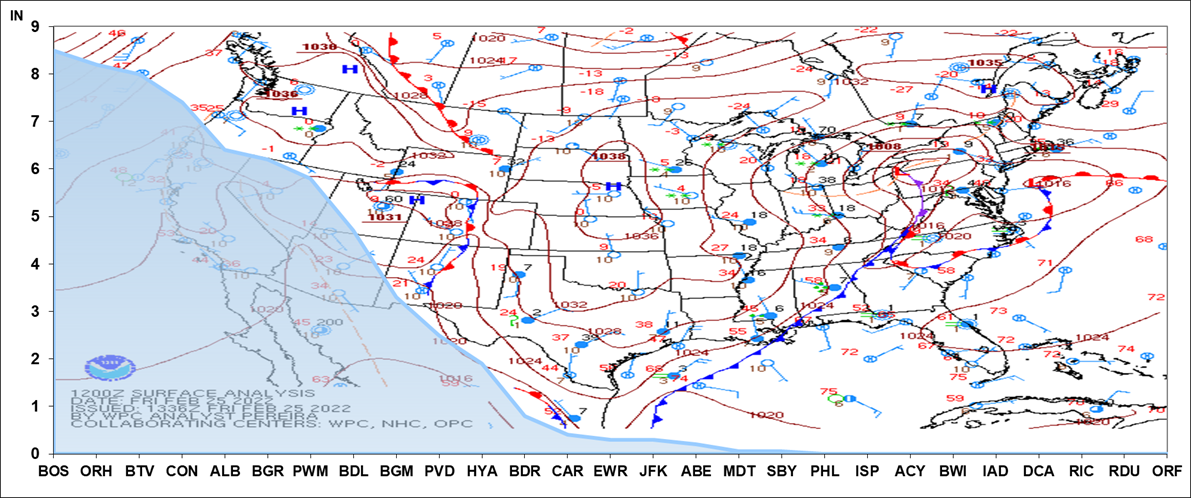
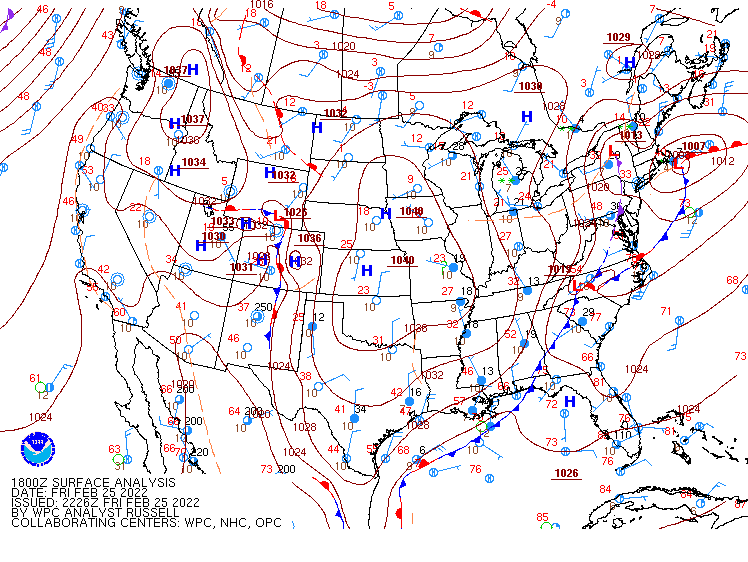
SFC analysis: 12z ... 25-FEB-22 and Storm-total Snowfall by Station
Image courtesy DOC / NOAA / NWS / NCEP / WPC
https://www.wpc.ncep.noaa.gov/html/avnsfc.shtml
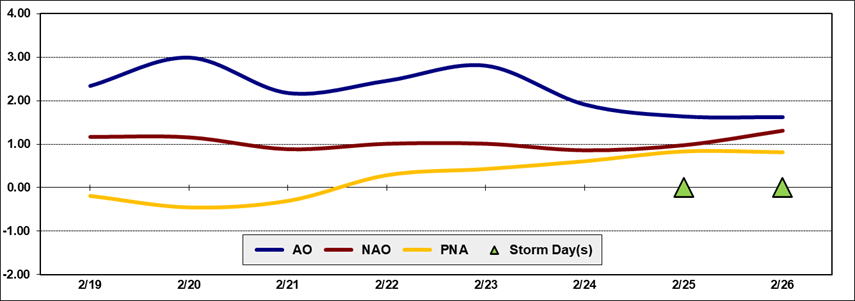
Teleconnection time-series data courtesy CPC
---
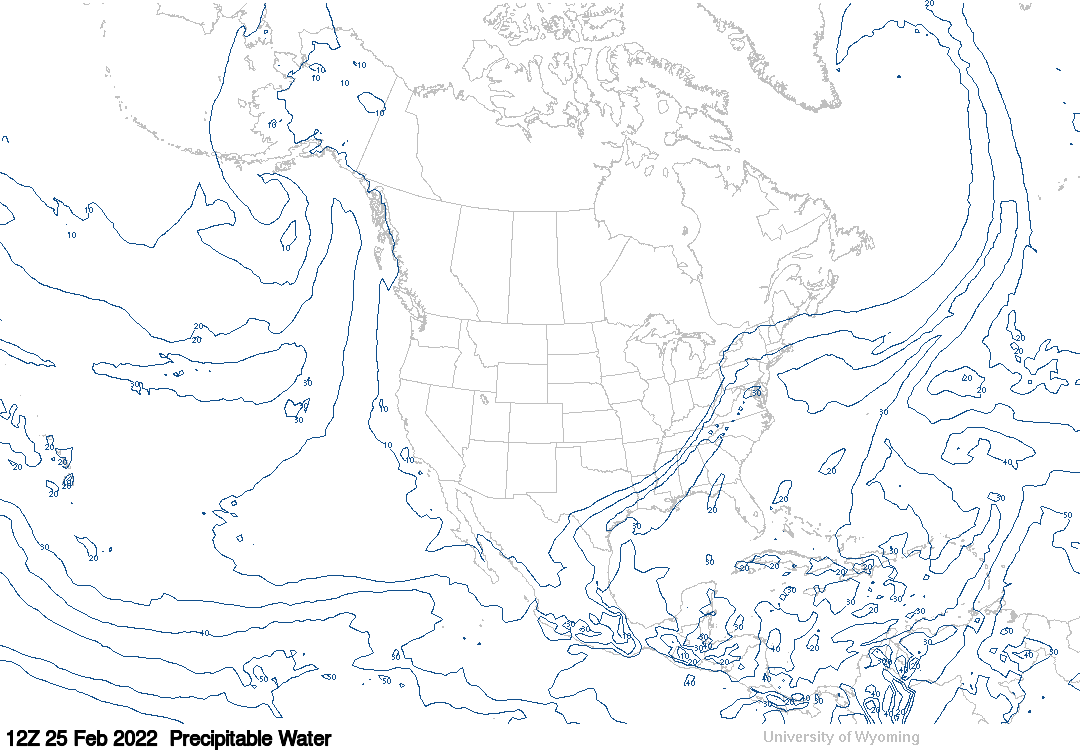
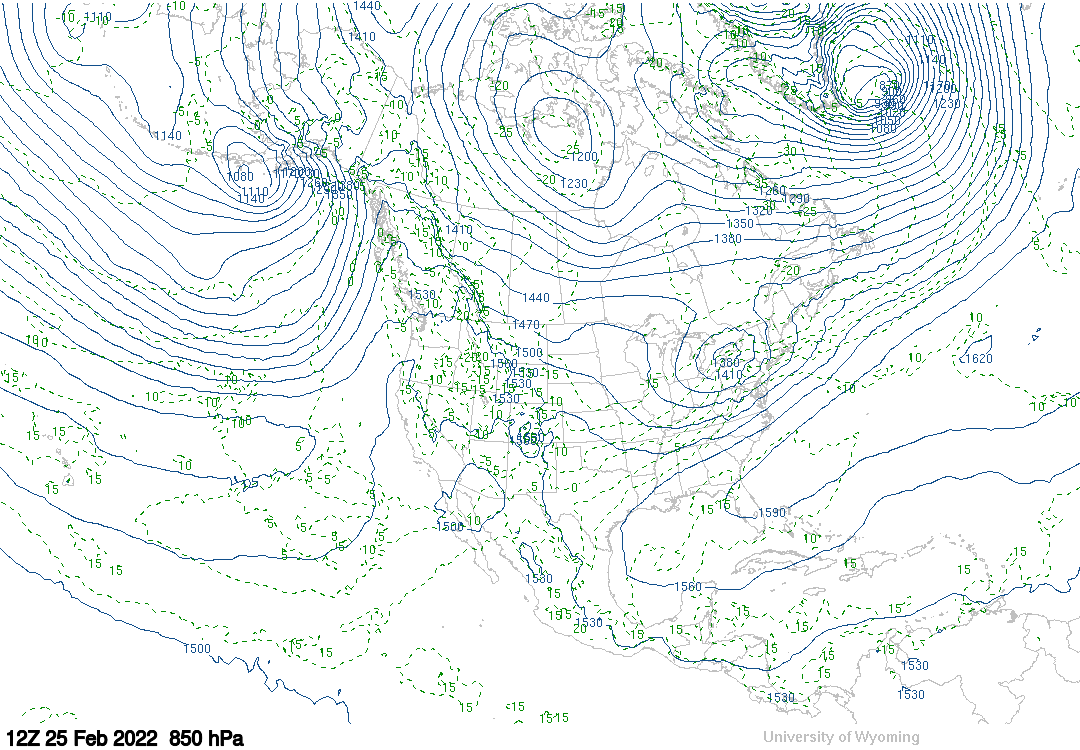
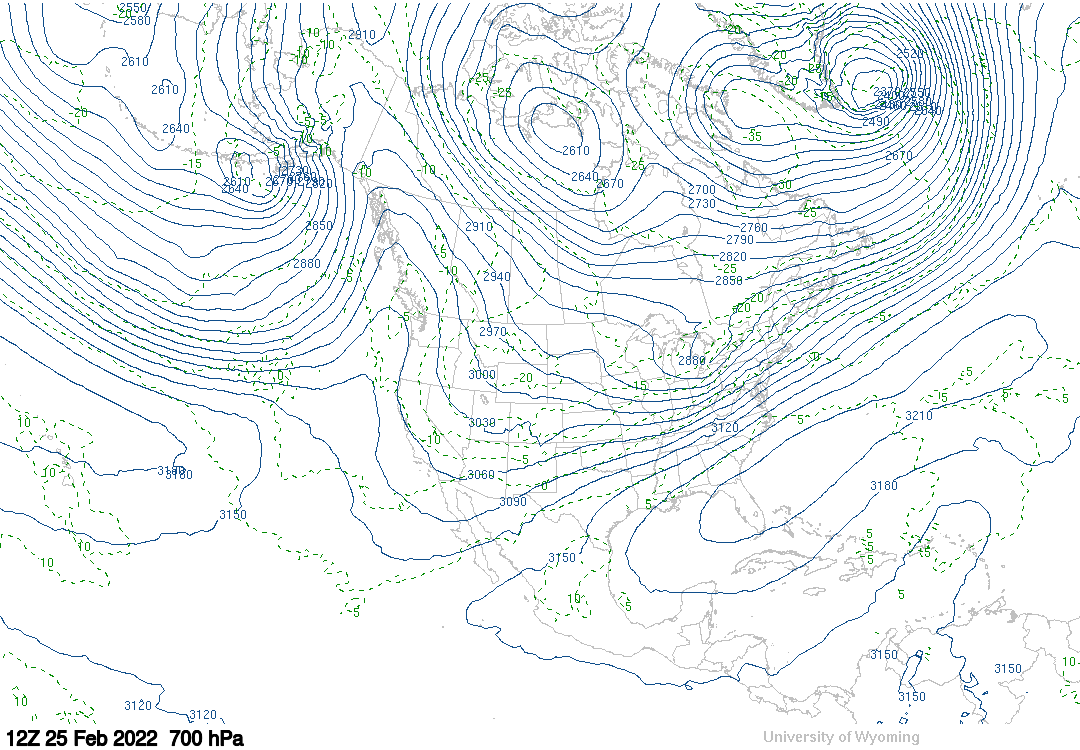
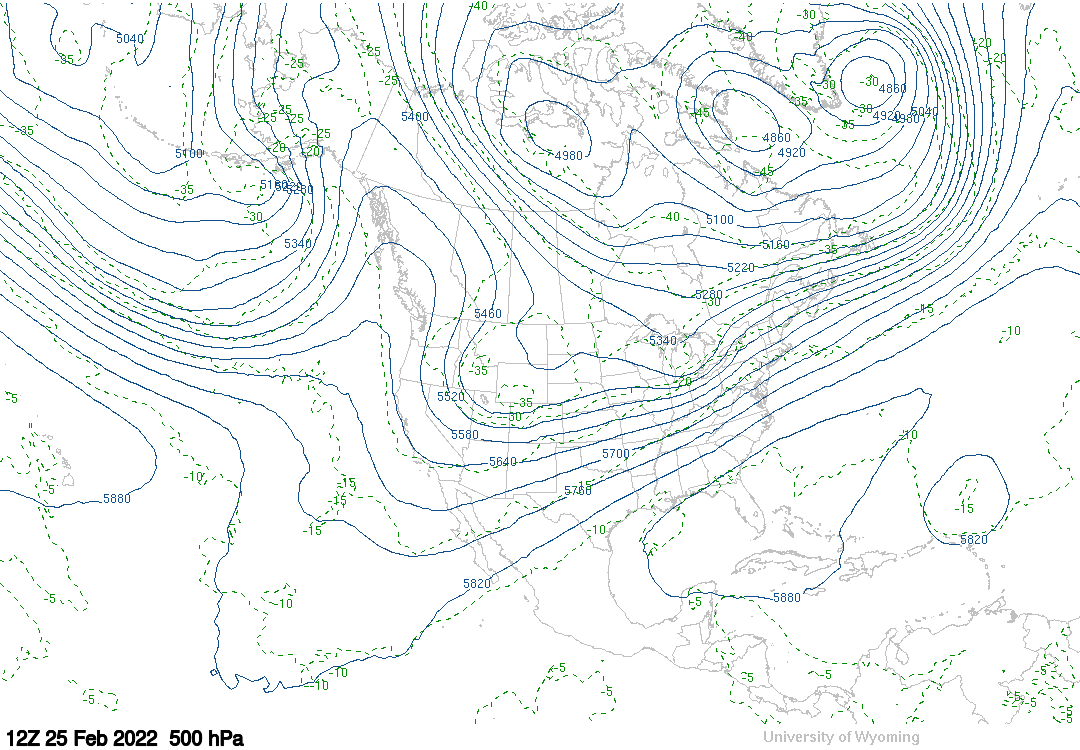
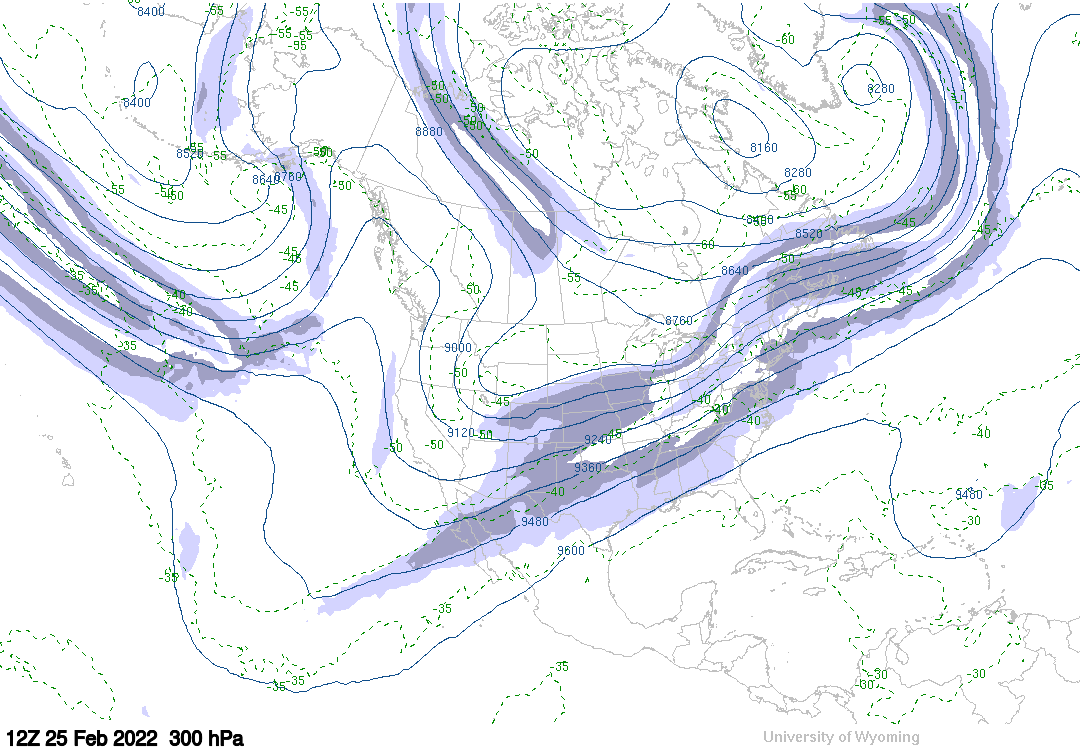
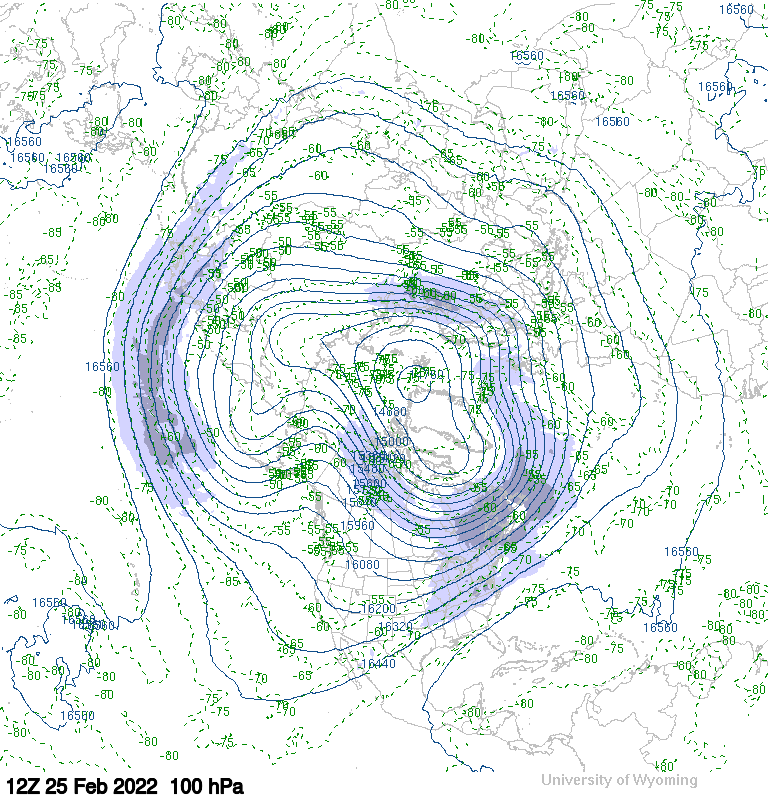
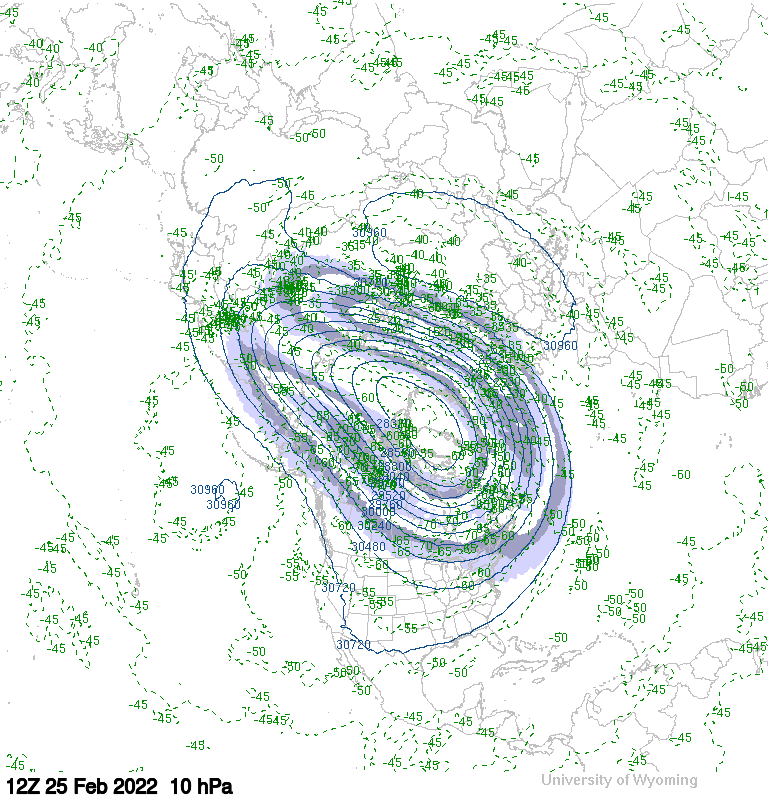
Upper air charts courtesy University of WY
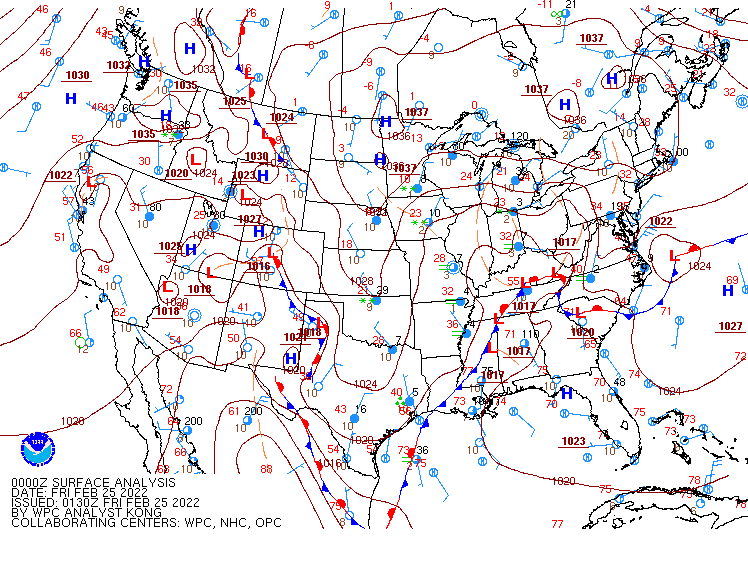
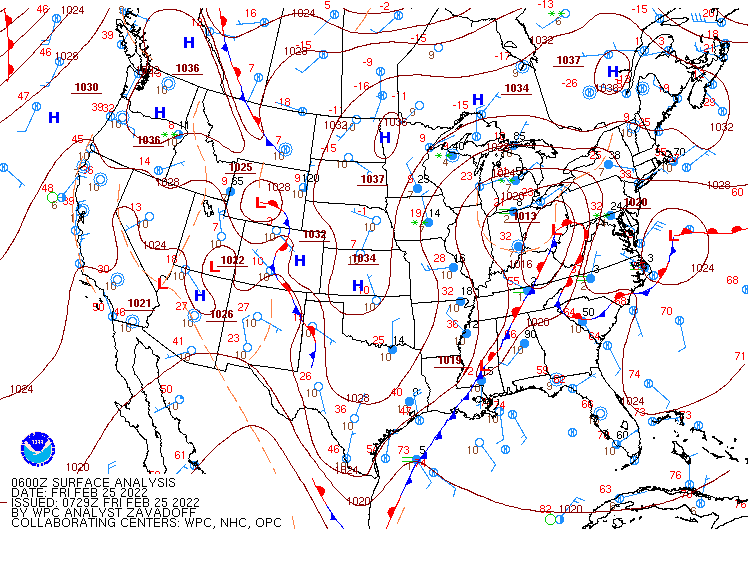
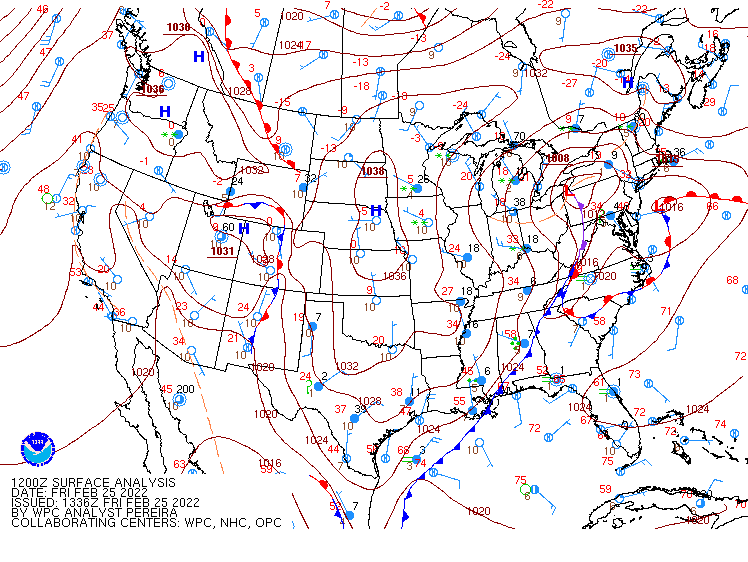
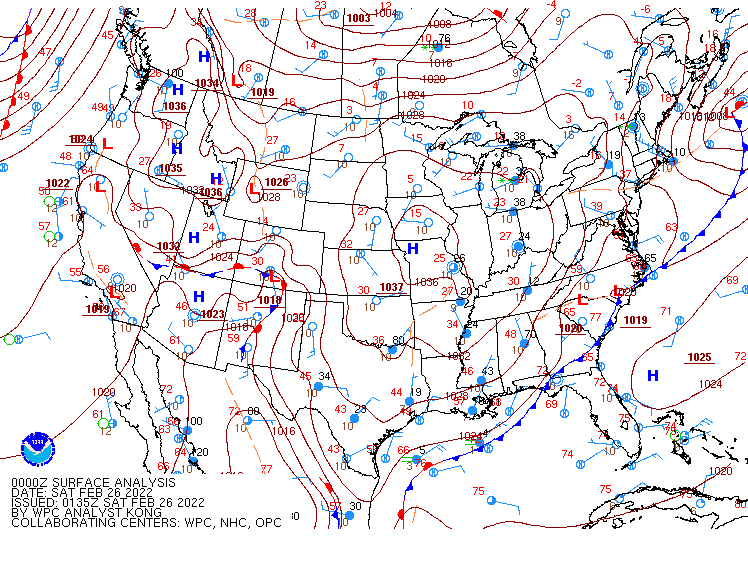
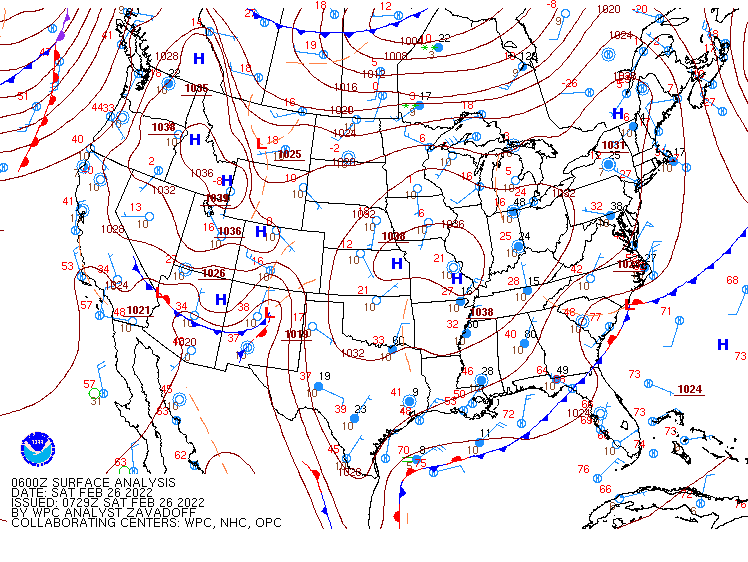
SFC analysis
Image courtesy DOC / NOAA / NWS / NCEP / WPC
https://www.wpc.ncep.noaa.gov/html/avnsfc.shtml
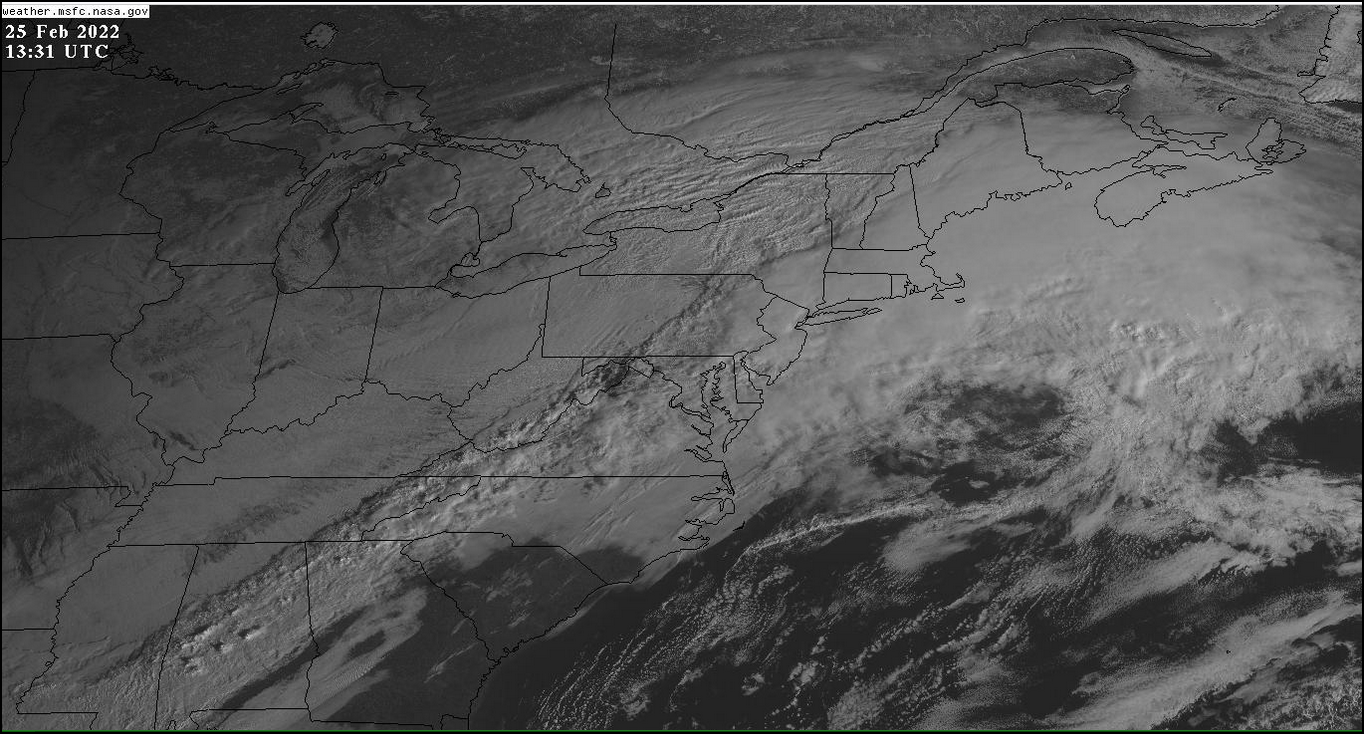
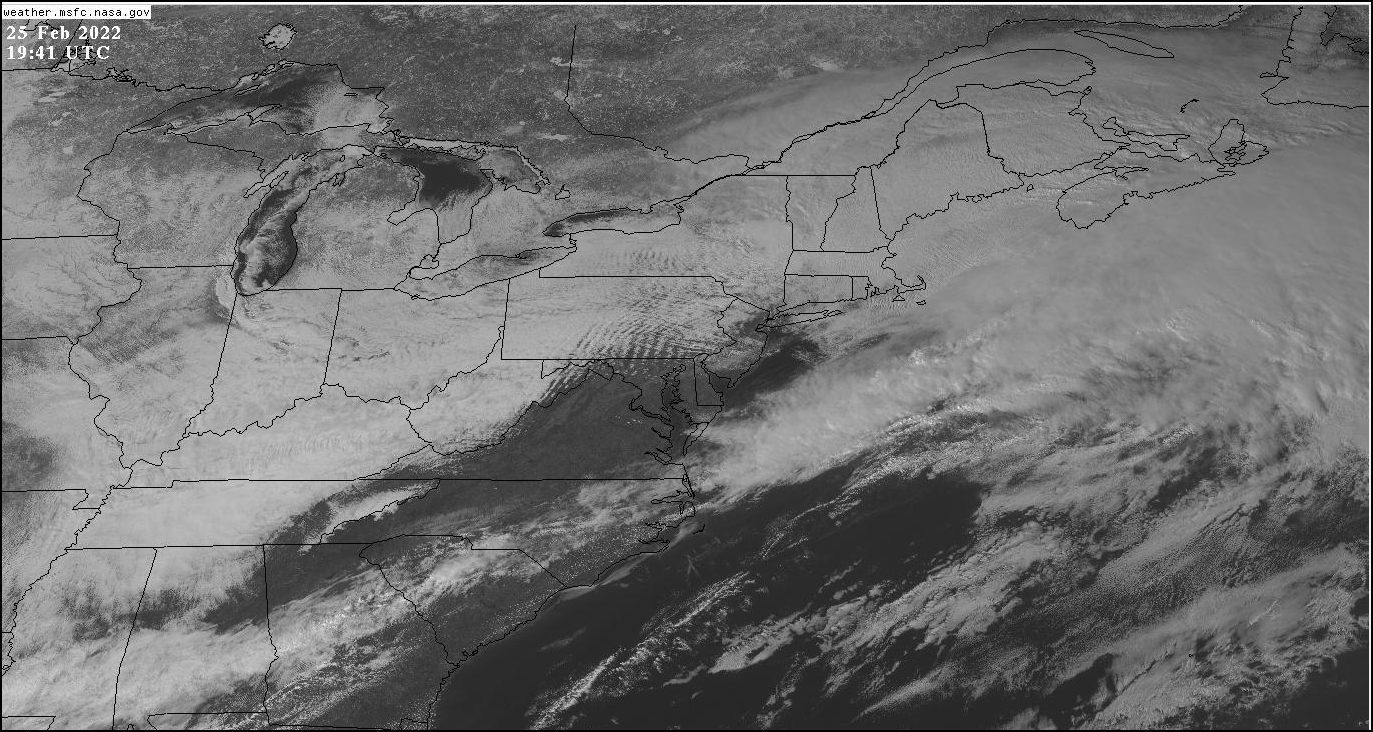
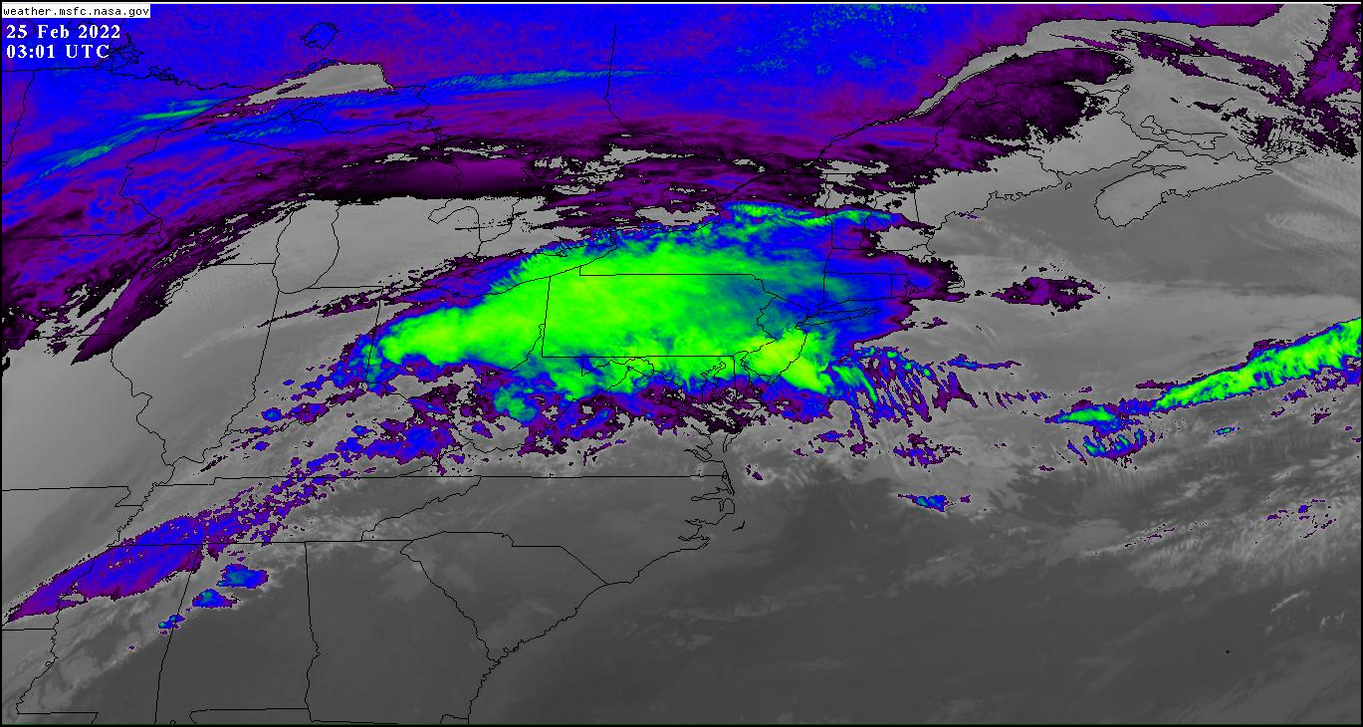
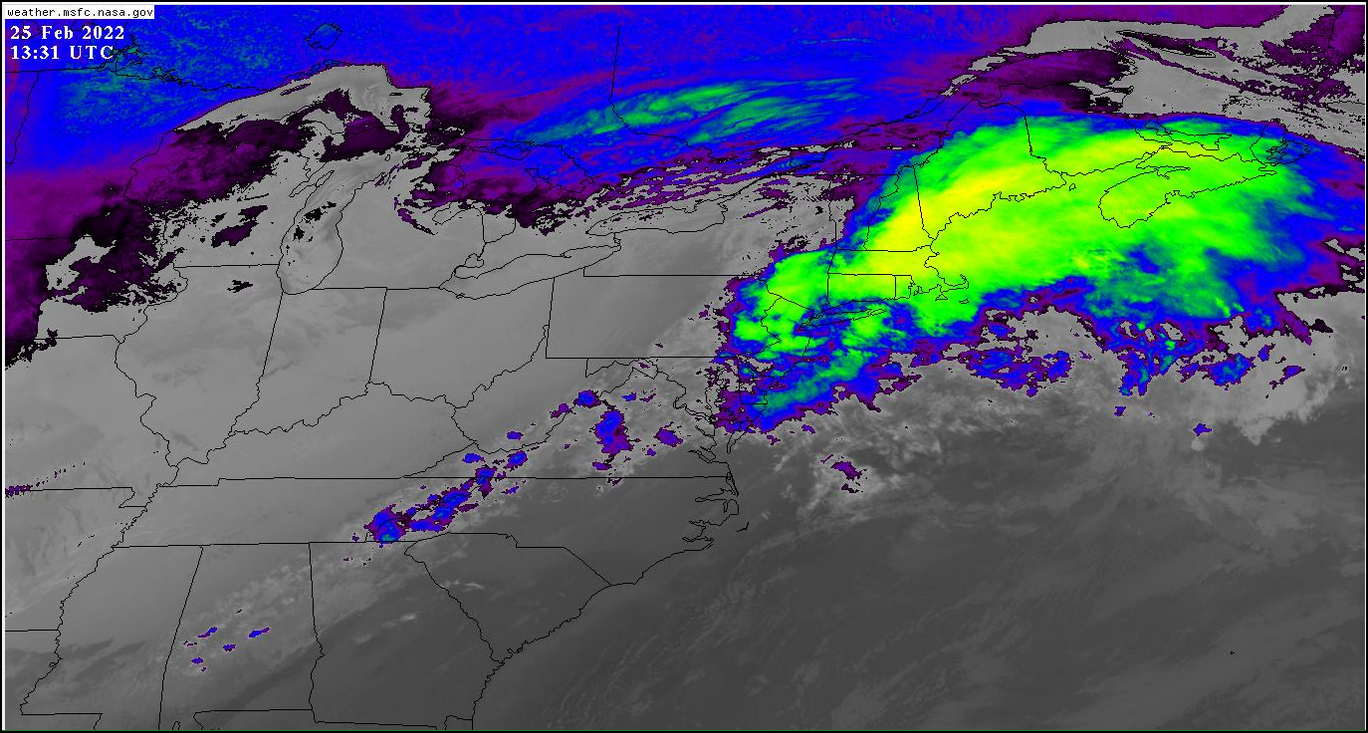
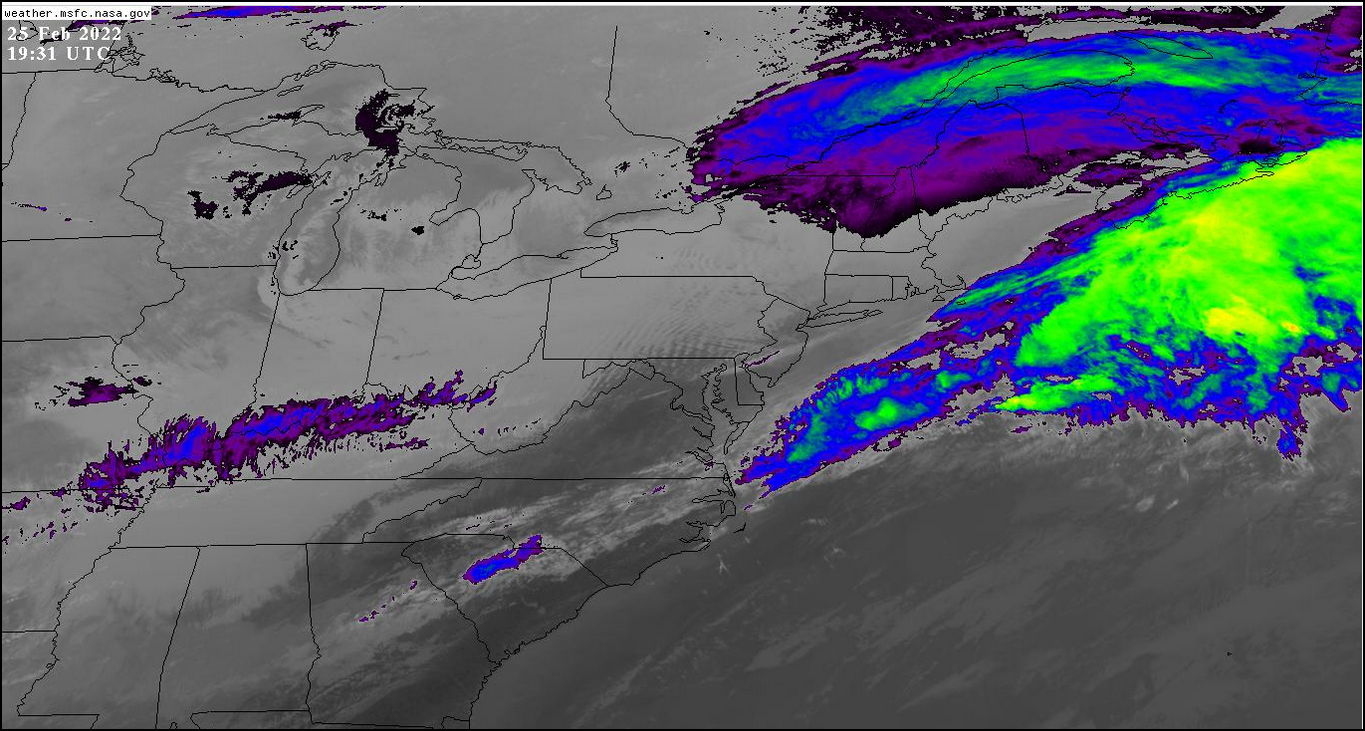
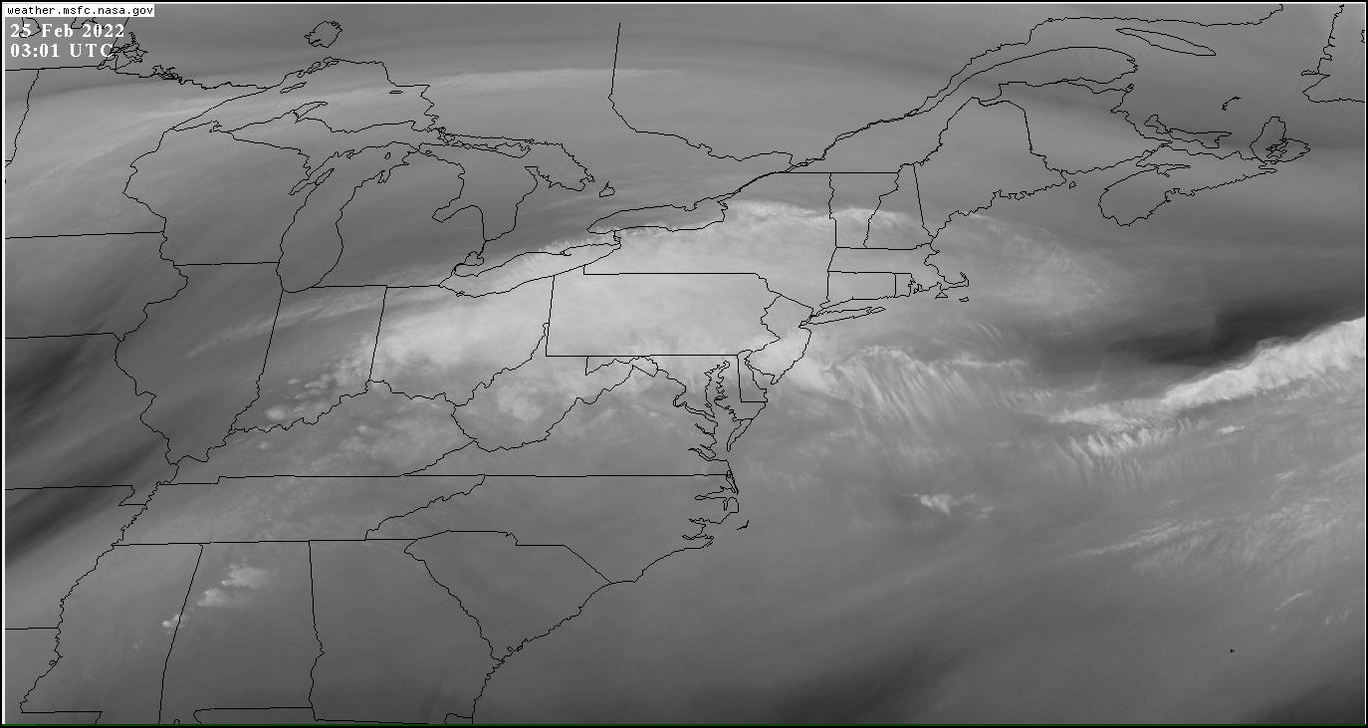
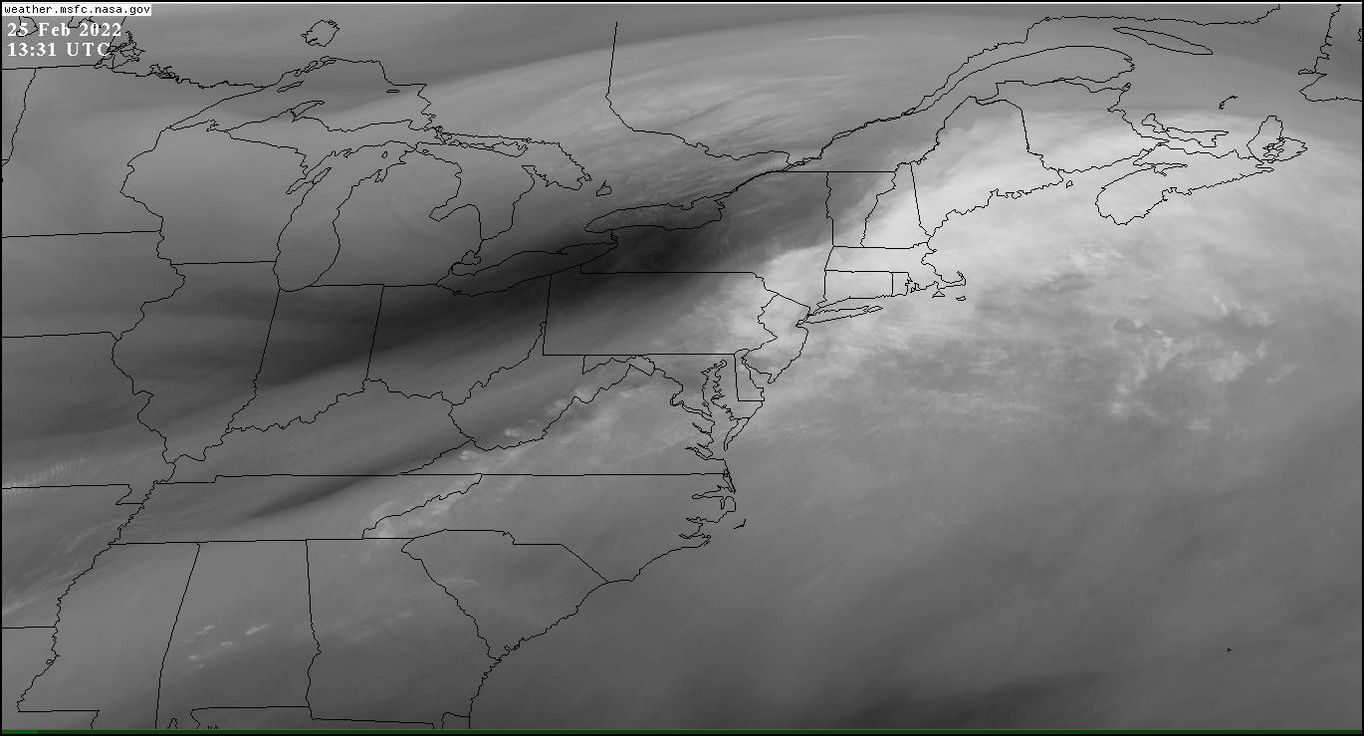
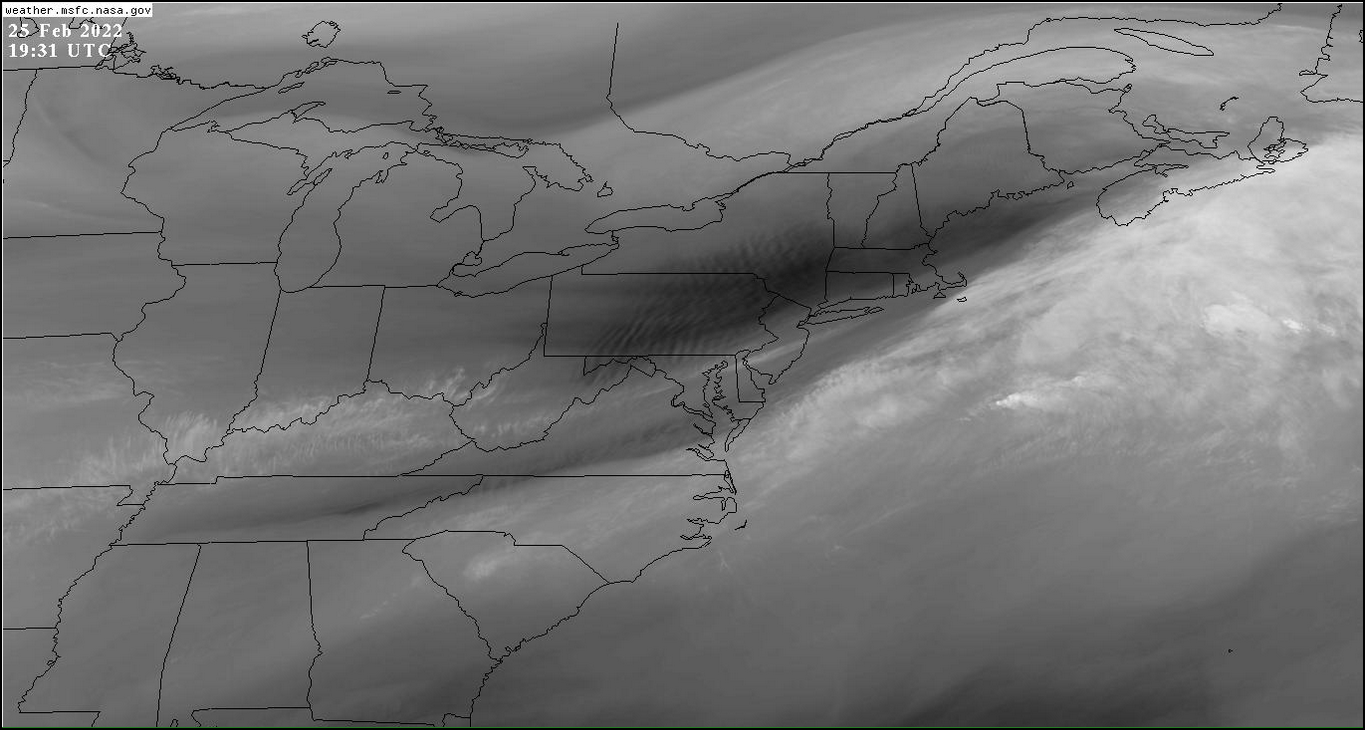
Imagery courtesy George C. Marshall Space Flight Center Earth Science Branch
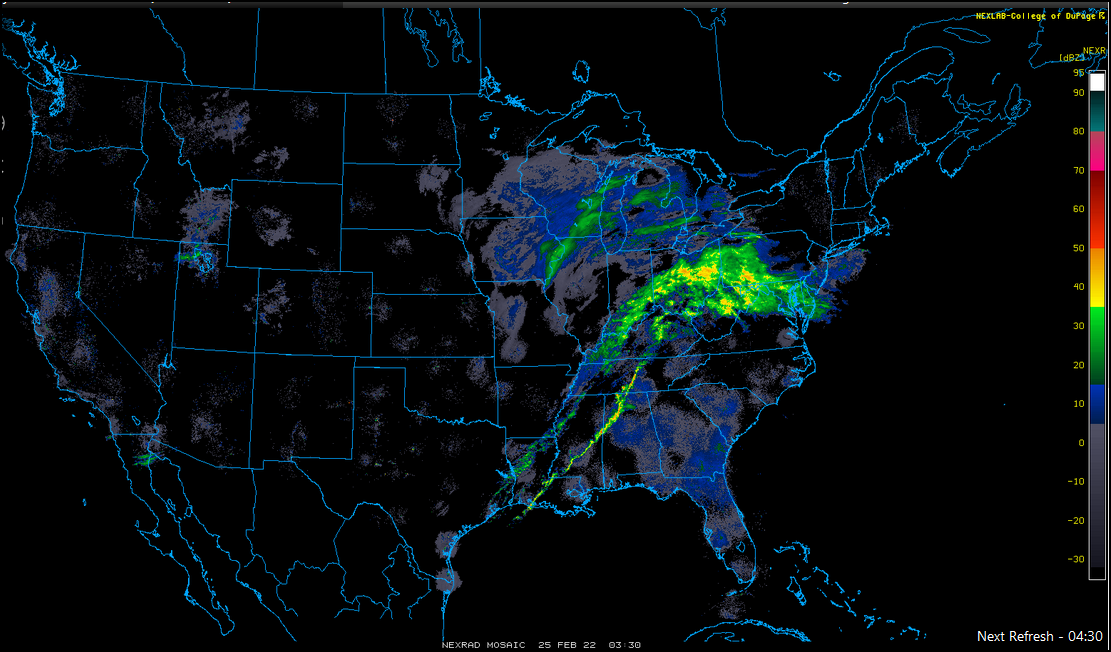
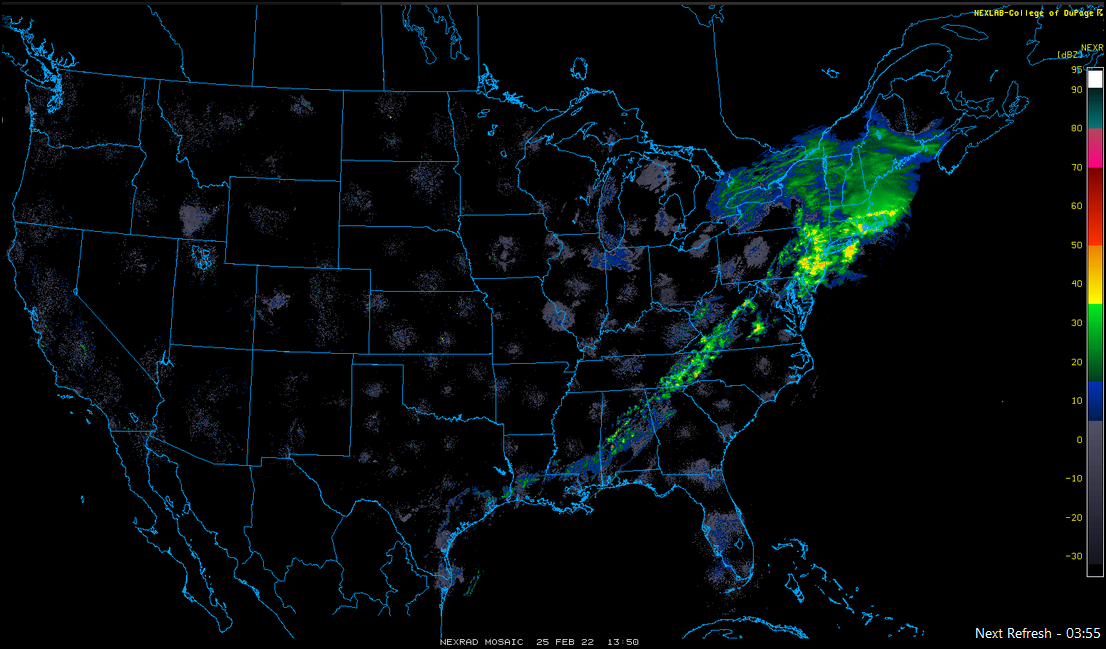
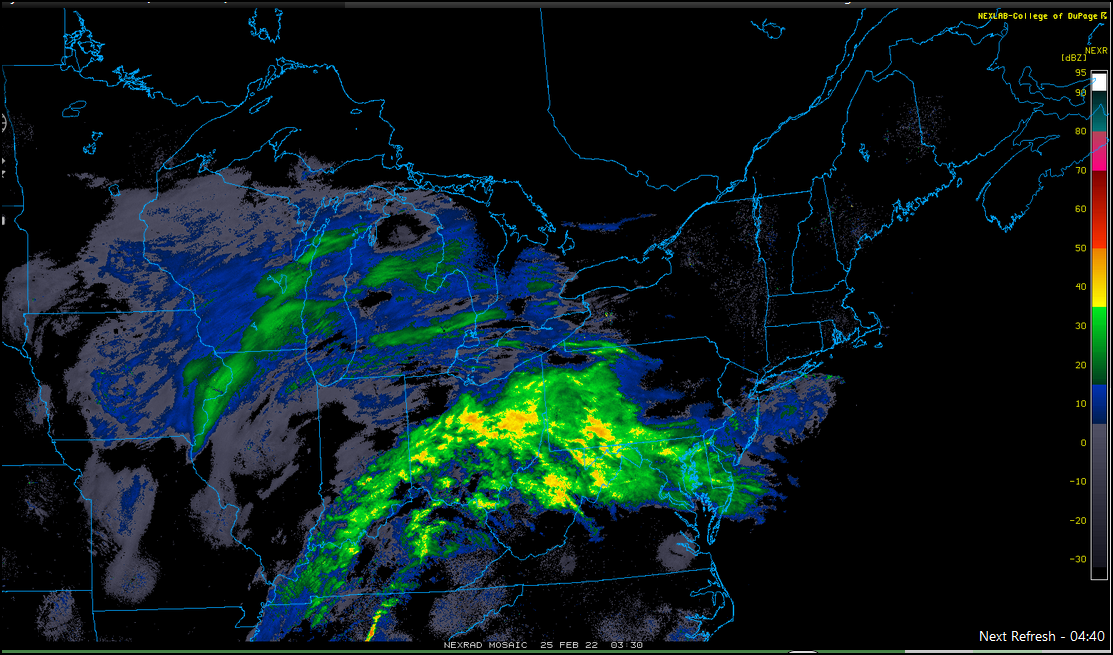
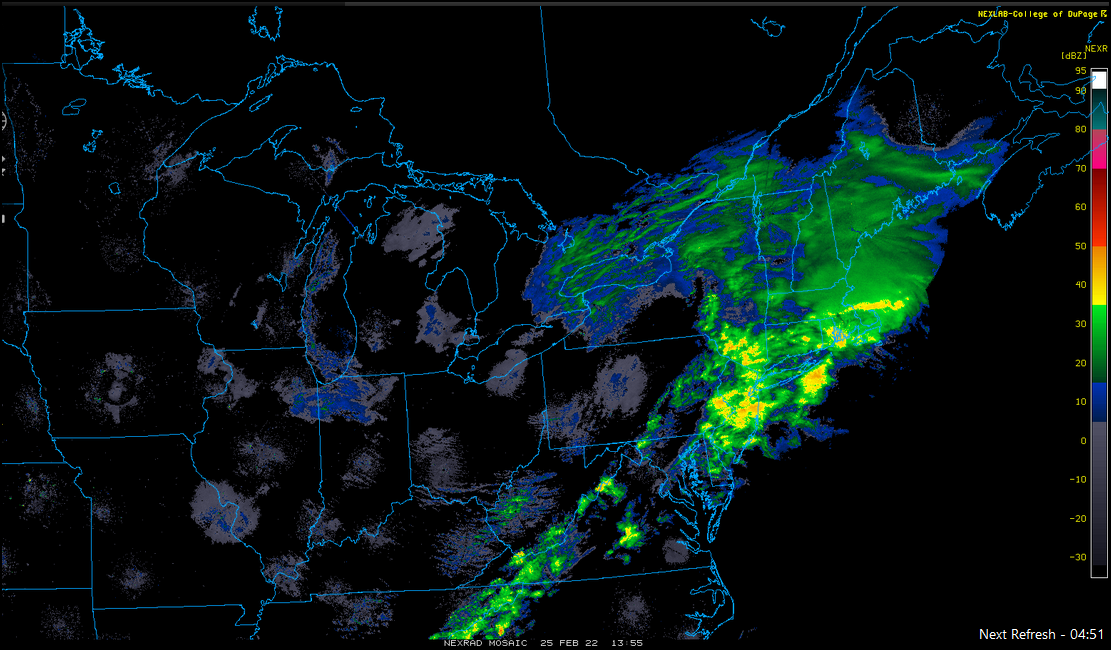
Radar imagery courtesy College of DuPage NEXLAB