Complete Results @ http://www.newx-forecasts.com/
Follow the left-panel link from '23nd Annual Snow Storm Contest > Verified Forecasts > ‘03-FEB-22’ to see the complete forecasters’ verification table by station
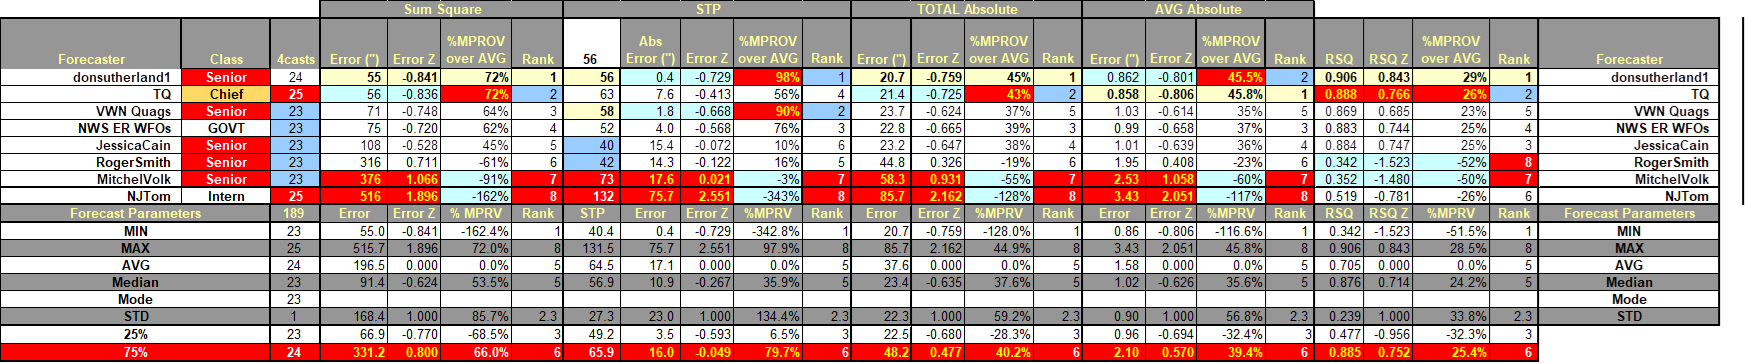
In the table ...
Yellow cells indicate the best score in category.
Forecast STP cells: yellow if within +/- 5% of observed STP.
Blue (Red) cells indicate the 25% (75%) percentile.
SUMSQ: sum of square errors (measure of forecast accuracy accounting for magnitude and distribution of snowfall)
STP: storm total precipitation
TAE: total absolute error
AAE: average absolute error
Final Standings - all Forecasters
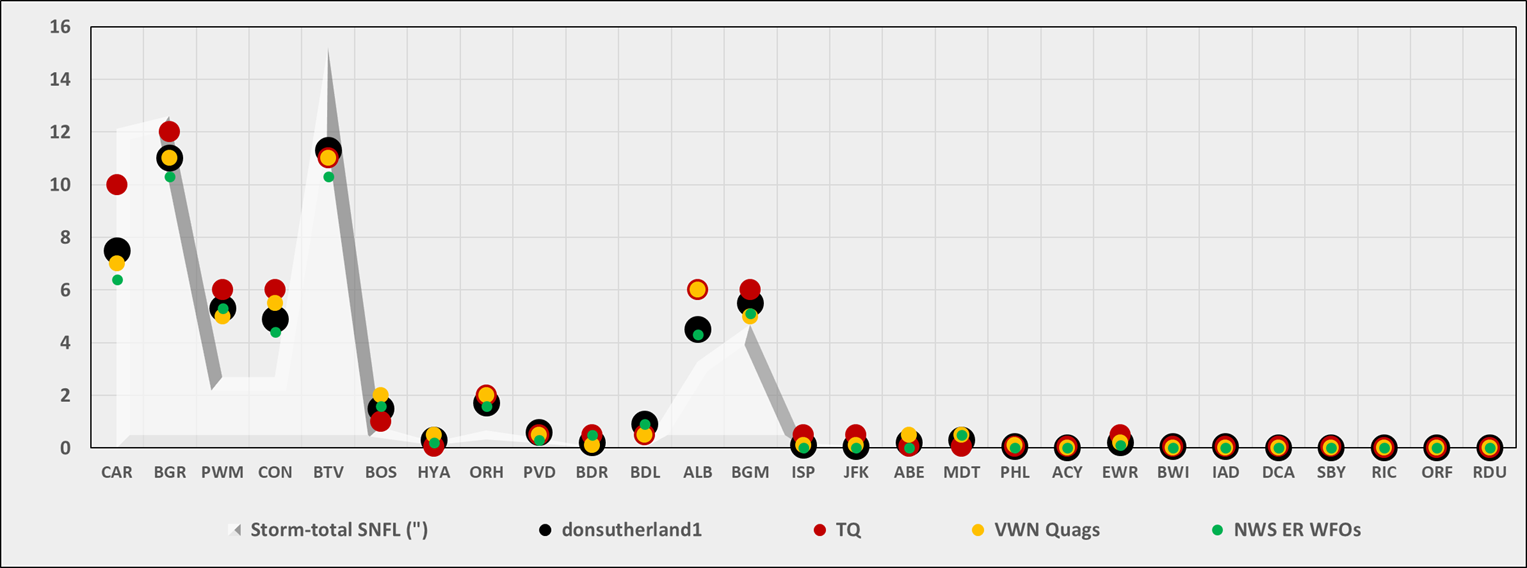
Station by Station Comparison of Top 4 Forecasts and Observed Storm-total Snowfall (STP)
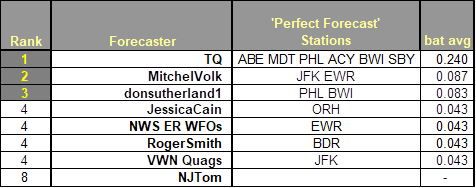
Perfect Forecasts (Batting Average - Forecast Stations with No Error)
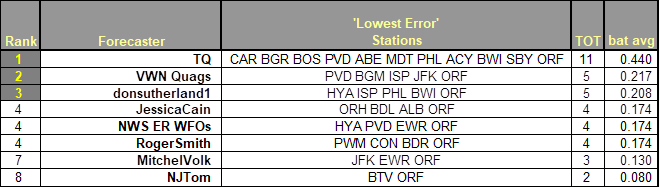
Best Station Forecasts (Batting Average - Forecast Stations with Lowest Absolute Error)
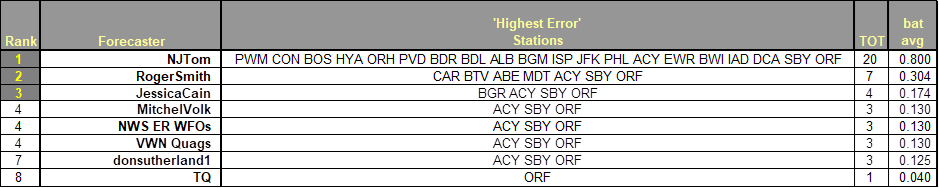
Best Station Forecast Busts (Batting Average - Forecast Stations with Highest Absolute Error)
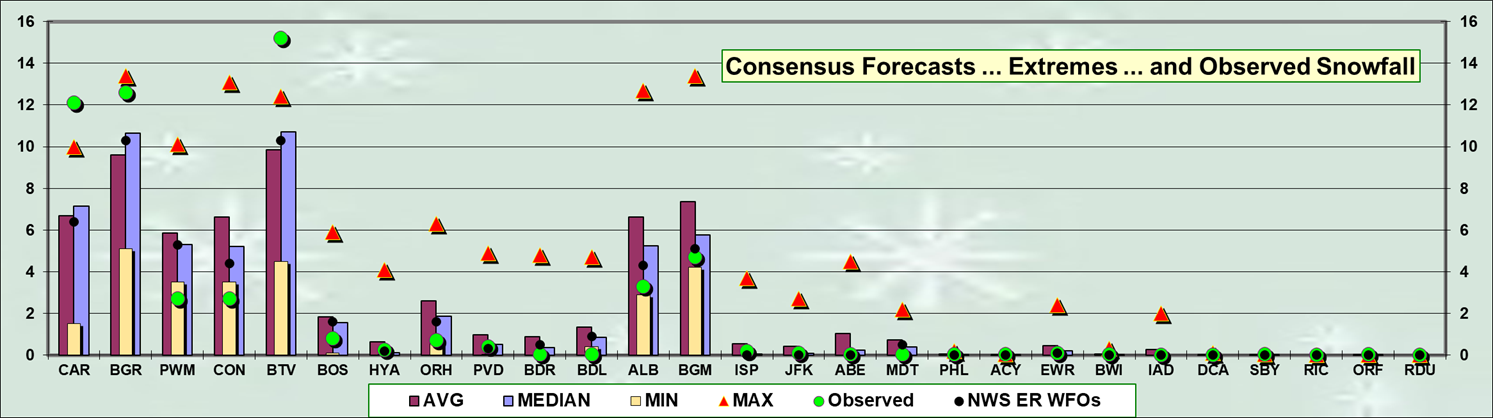
Consensus forecast best @
MAX forecast best @ CAR … BGR … BTV
MAX forecast less than observed @ CAR … BTV
MIN forecasts best @ PWM … CON … ORH … BDL … ALB … BGM
MIN forecasts more than observed @ PWM … CON … BDL
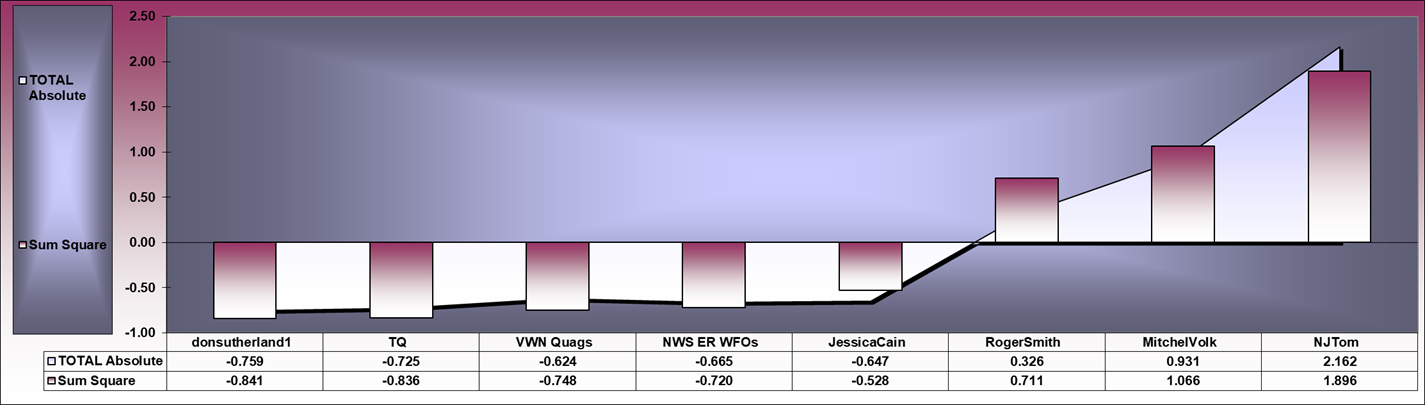
Strong correlation (R = 0.982) between SUMSQ and TAE Z-scores
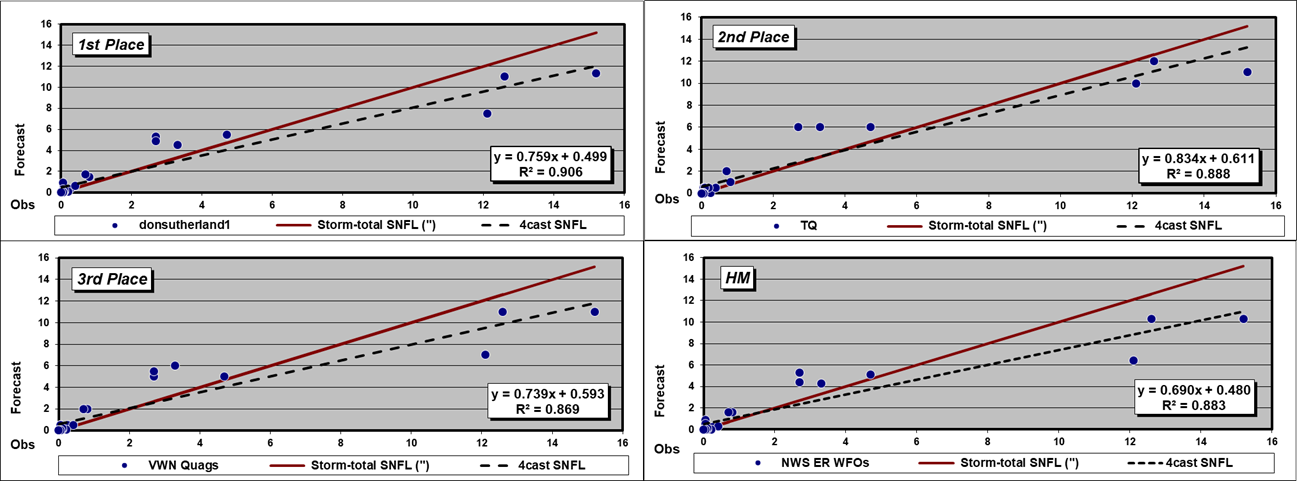
A dashed Forecast trend line above (below) solid red Observed snowfall line ==> over (under) forecast
R2 value indicates how well the forecast captured the observed snowfall’s variability … i.e., R2 = 0.874 ==> the forecast captured ~87% of the observed snowfall’s variability.
*******************************
Verification of storm-total snowfalls for THU … 03-FEB-22 through SAT … 05-FEB-22 from CDUS41 (CLI) ... CXUS51 (CF6) ... METARs ... and PNS bulletins. Excellent coverage and reporting.
HYA
STP estimated from NOHRSC reports using inverse distance weighting of vicinity reports.
Liquid equivalents recovered from METARS for several stations with missing climate bulletins data.
---
Snow-to-liquid ratio (SLR) not reported for some stations with measurable snowfall b/c significant liquid and / or freezing precipitation also occurred during the verification period.
---
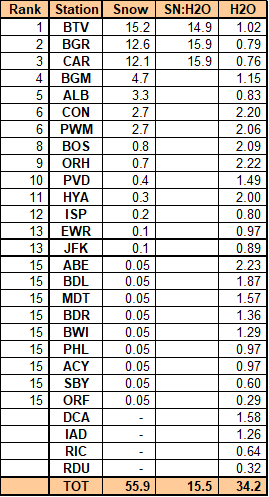
Stations observing >= Trace: 23 (85%)
Given stations had measurable snowfall ... stations observing at least:
4" - 4 (15%)
8" - 3 (11%)
12" - 3 (11%)
Max snow melt-water (minimum SLR 10:1)
BTV - 1.02"
BGR - 0.79"
CAR - 0.76"
Max precipitation (frozen + freezing + liquid):
ABE - 2.23"
ORH - 2.22"
CON - 2.20"
---
New daily record(s)
03-FEB-22
BTV - 6.5" (6.2"; 1910)
04-FEB-22
BGR - 11.4" (9.6"; 1990)
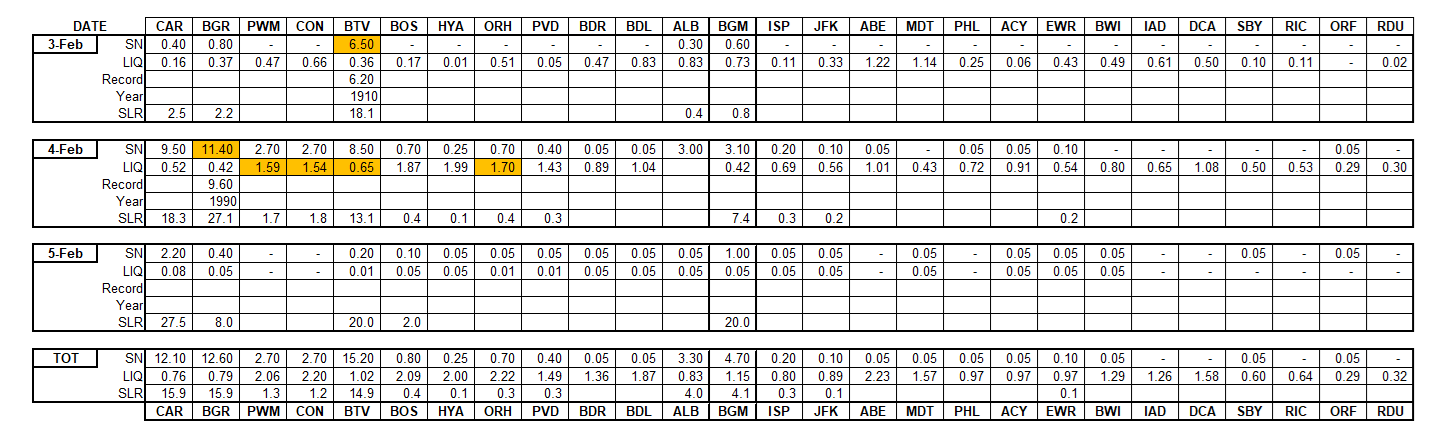
Orange cells indicate new daily record.
Trace amounts (0.05") are not included in STP.
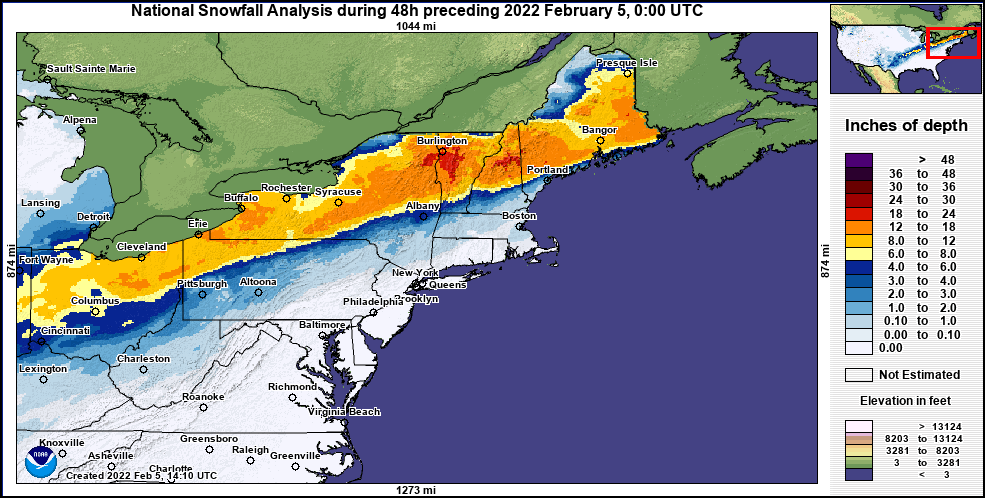
Approximate storm-total snowfall courtesy NOHRSC
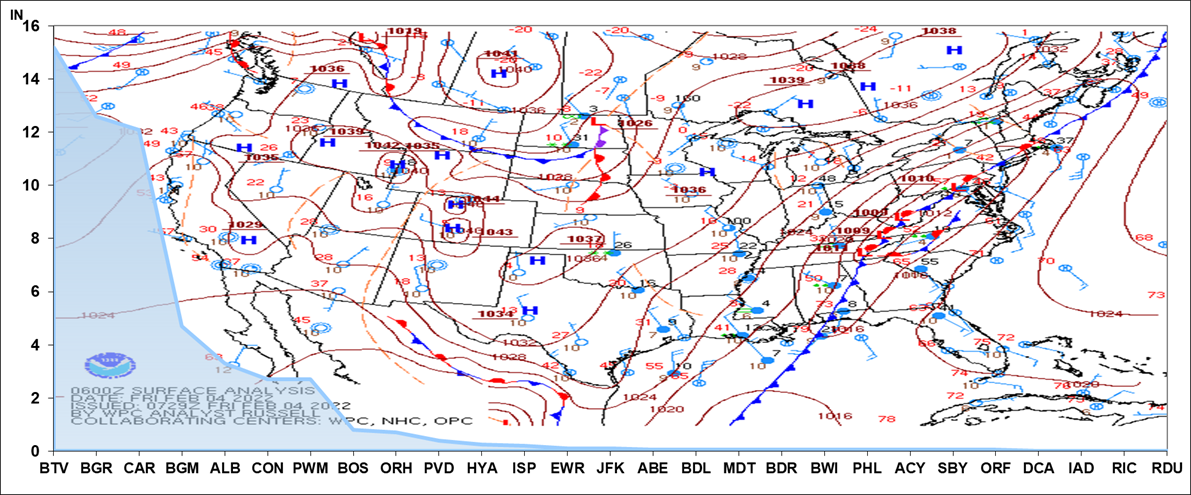
SFC analysis: 06z ... 04-FEB-22 and Storm-total Snowfall by Station
Image courtesy DOC / NOAA / NWS / NCEP / WPC
https://www.wpc.ncep.noaa.gov/html/avnsfc.shtml
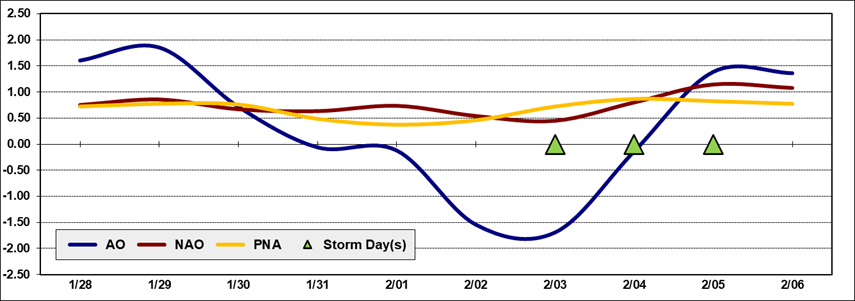
Teleconnection time-series data courtesy CPC
---
Upper air charts courtesy University of WY
SFC analysis
Image courtesy DOC / NOAA / NWS / NCEP / WPC
https://www.wpc.ncep.noaa.gov/html/avnsfc.shtml
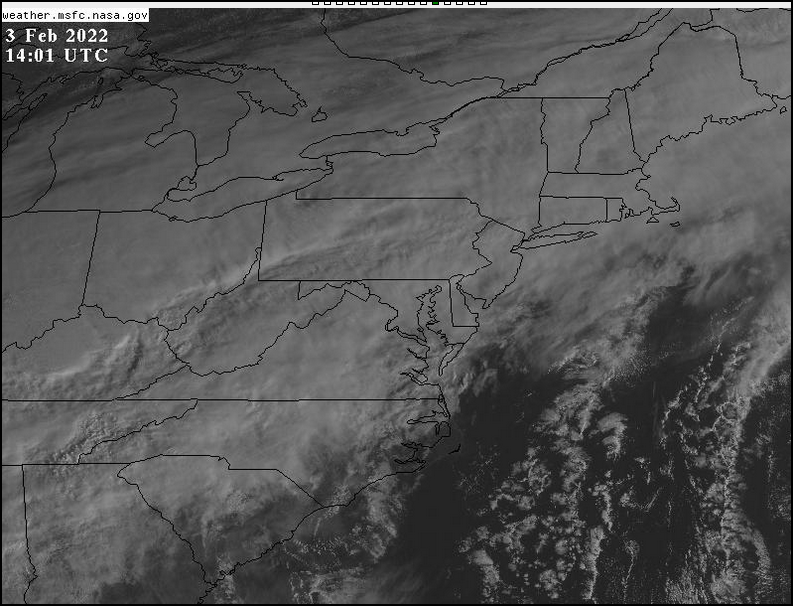
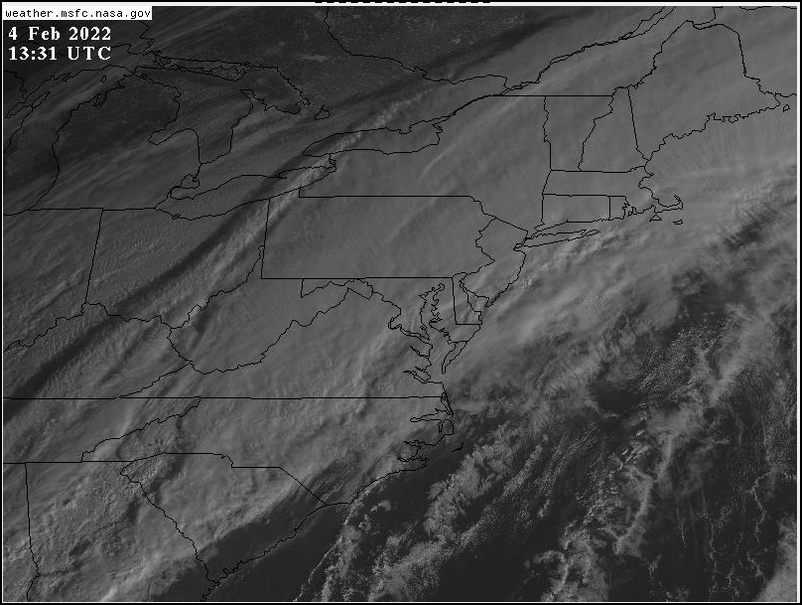
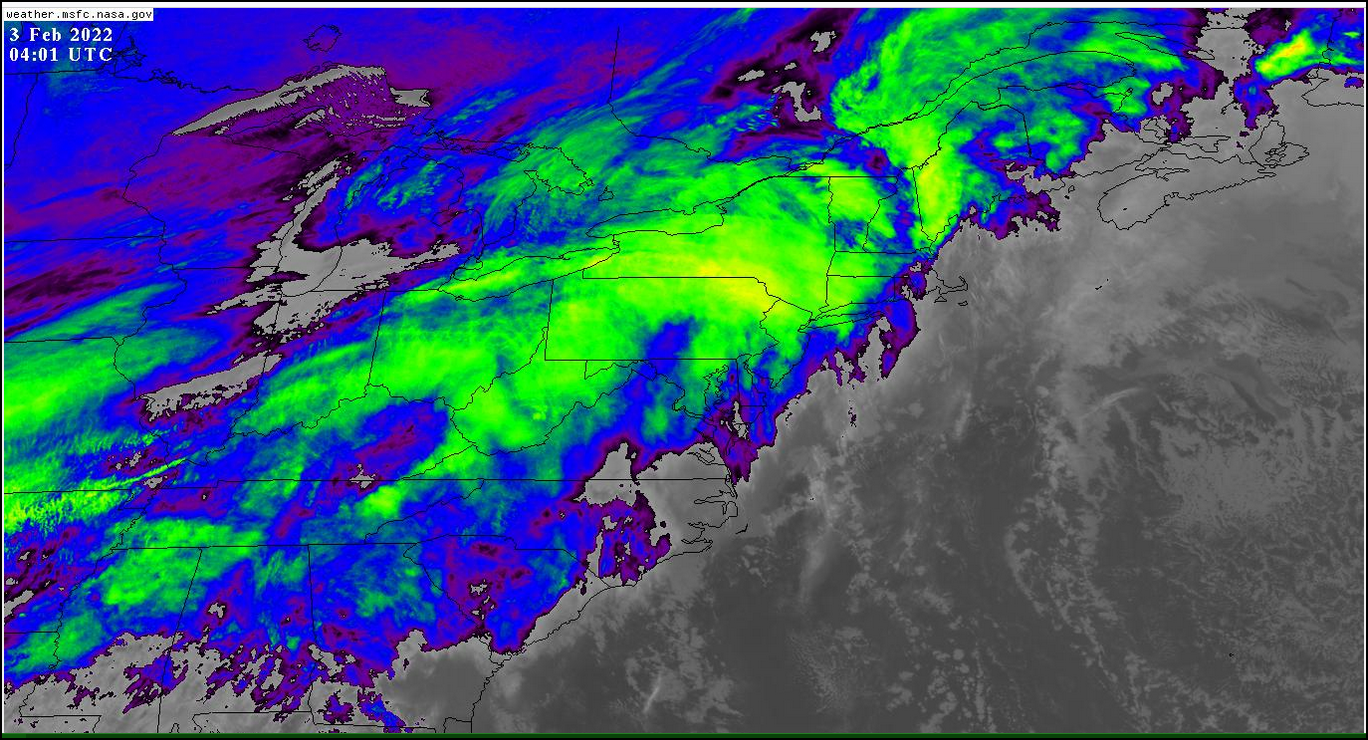
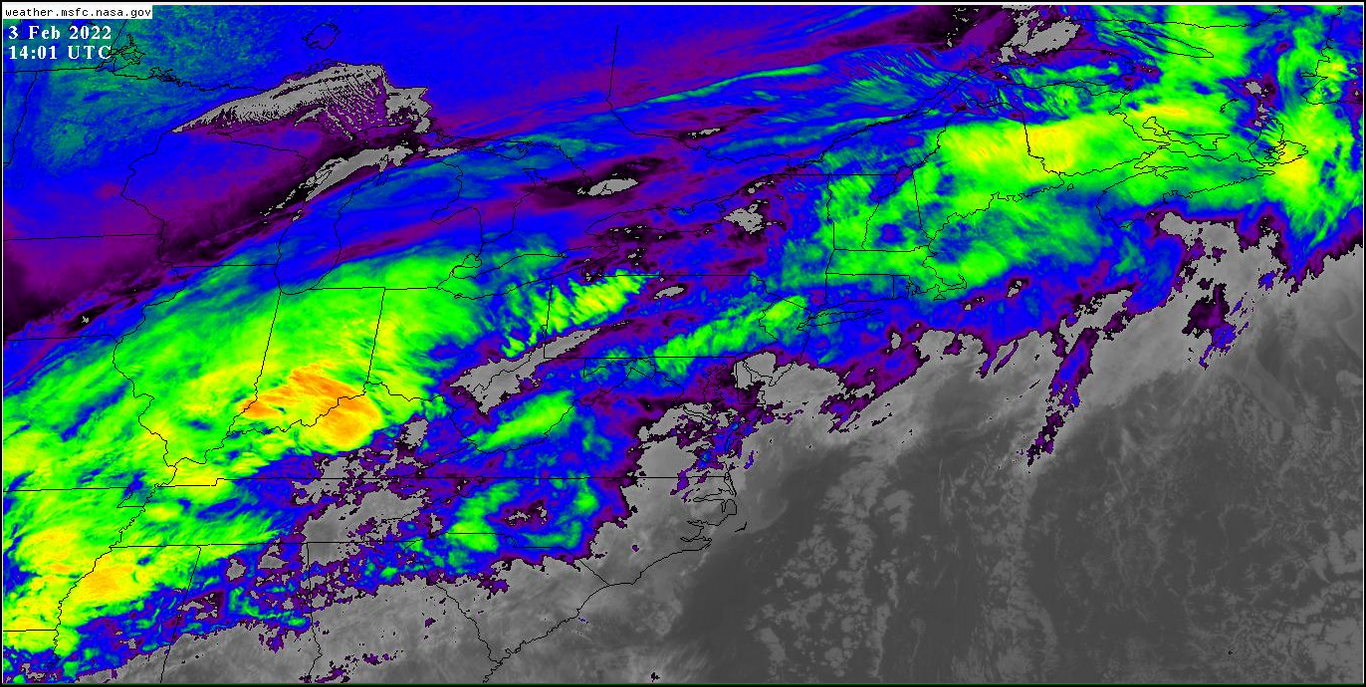
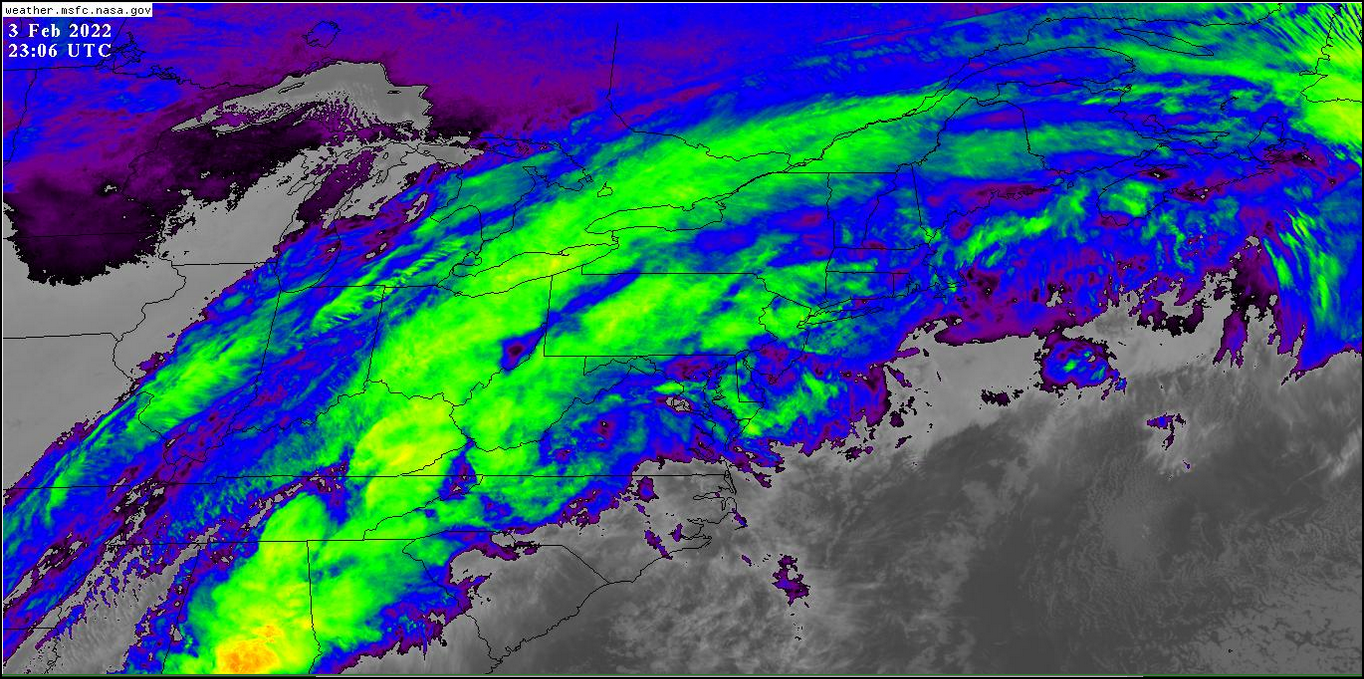
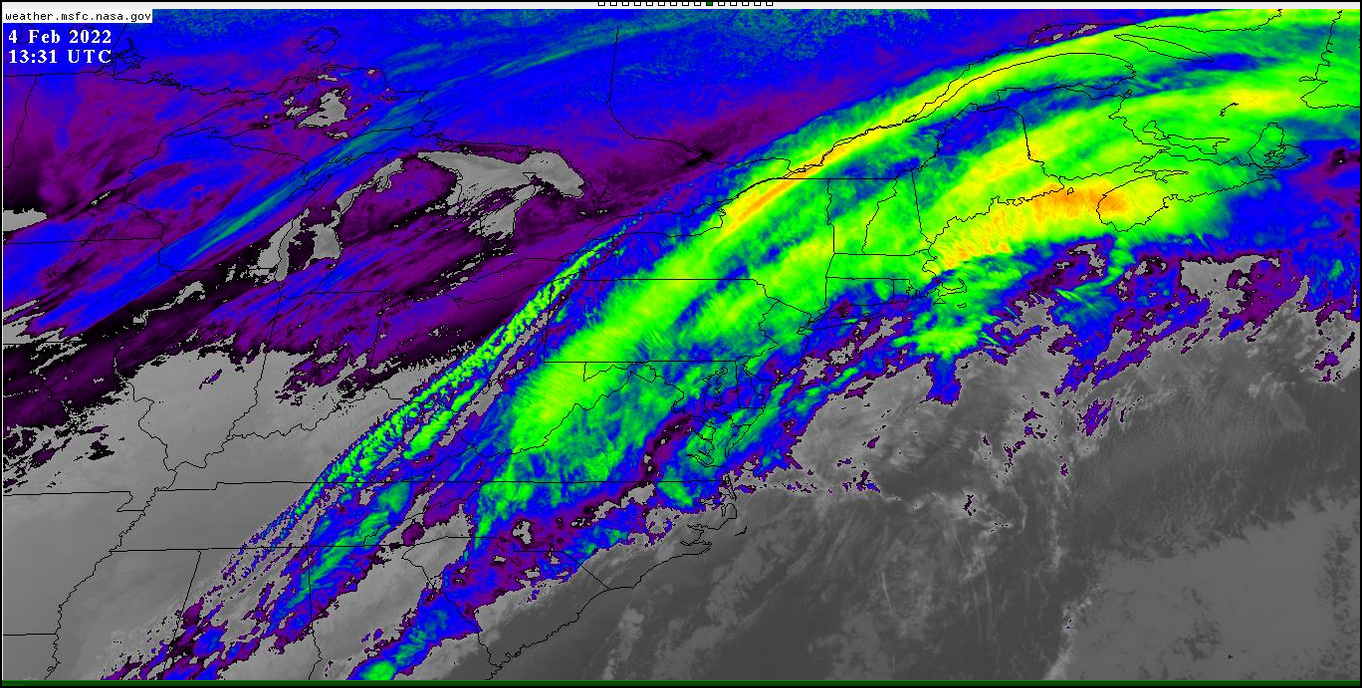
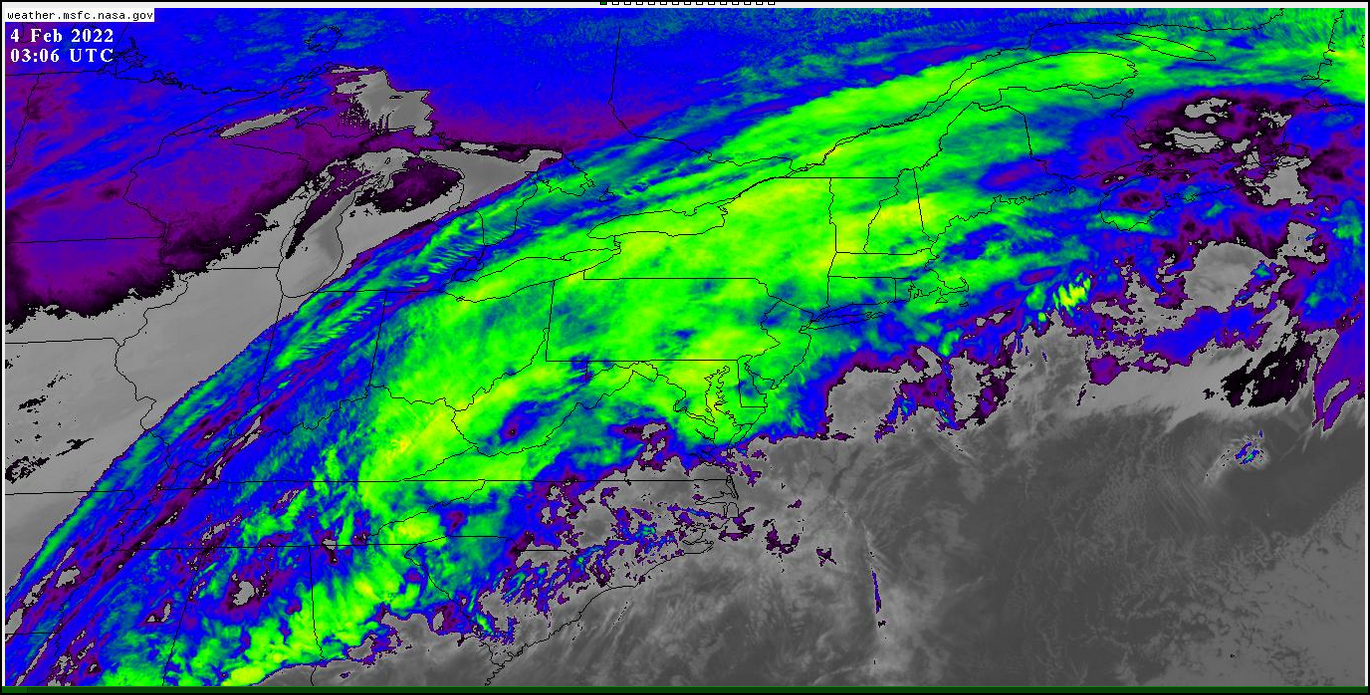
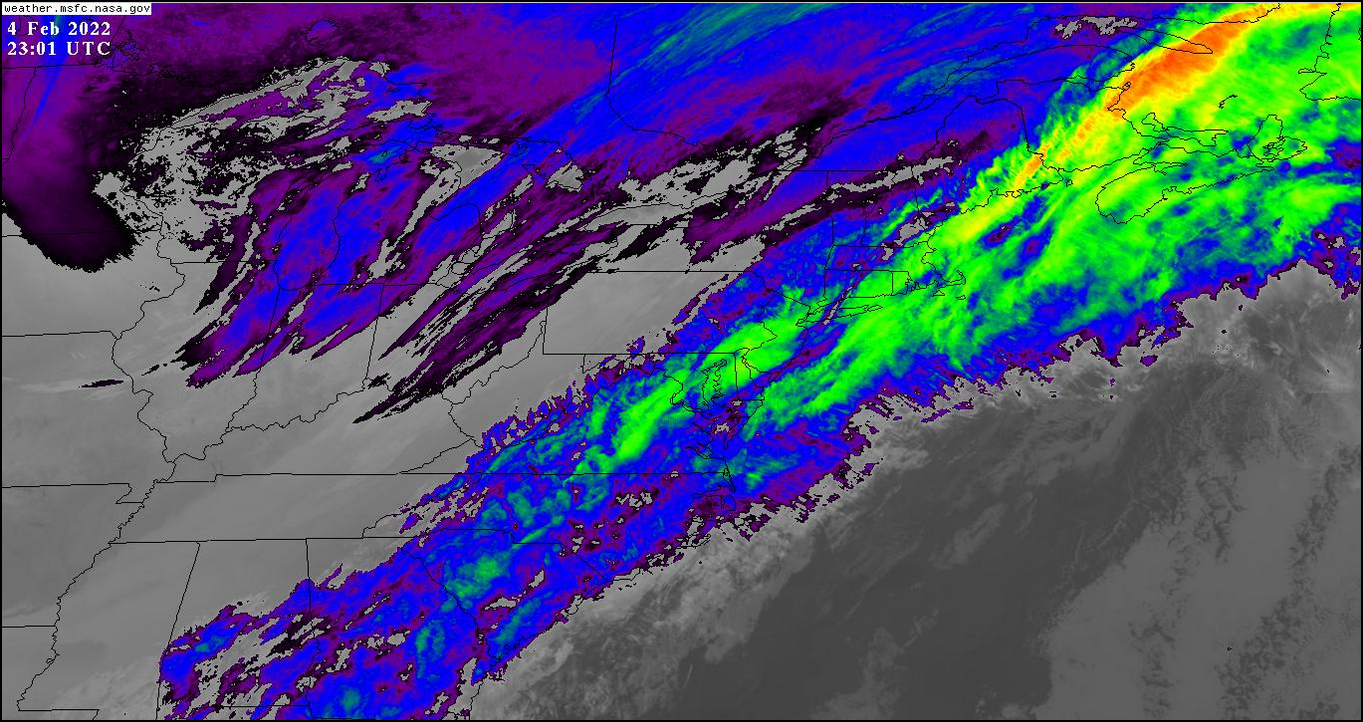
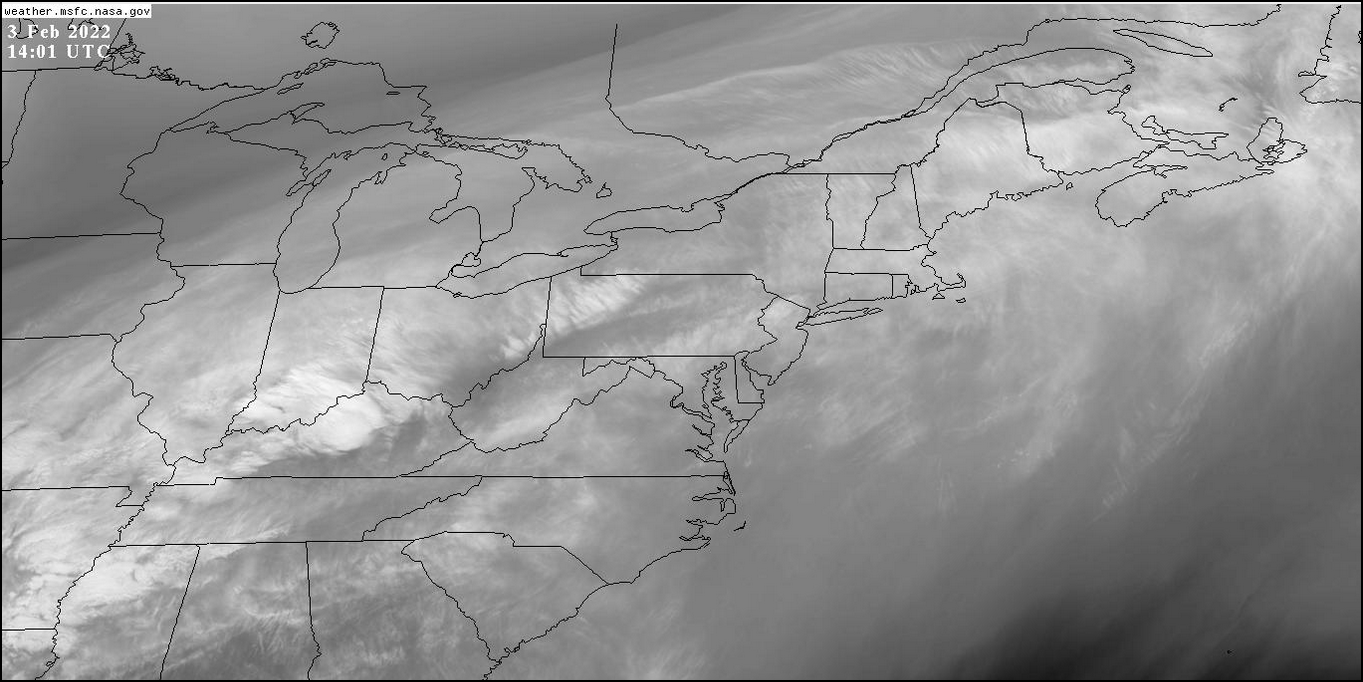
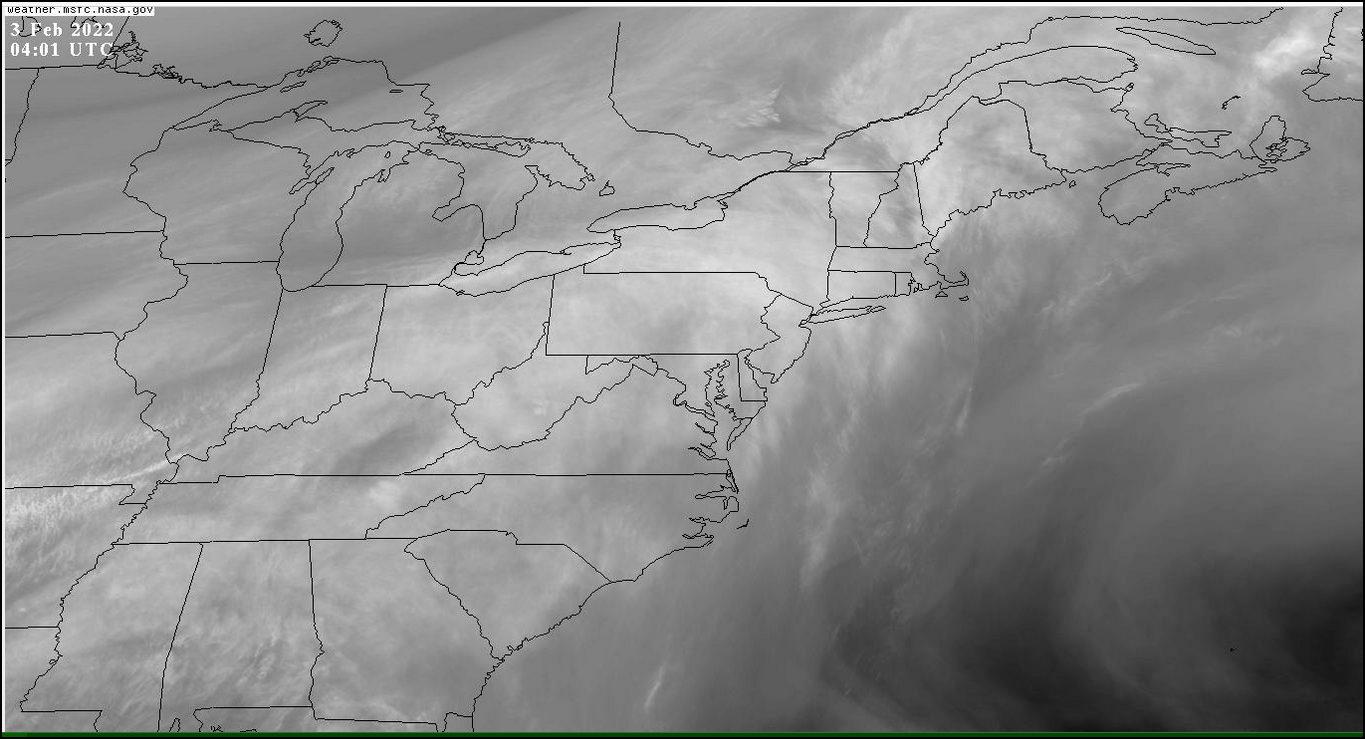
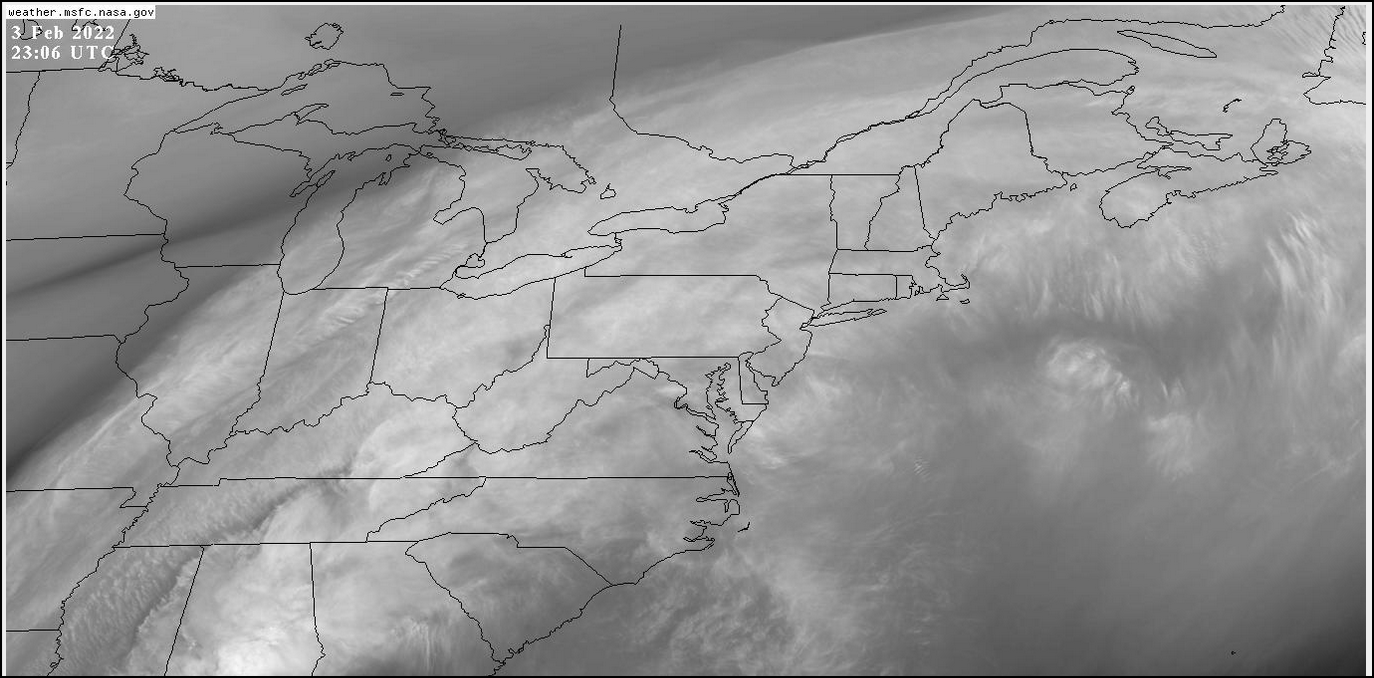
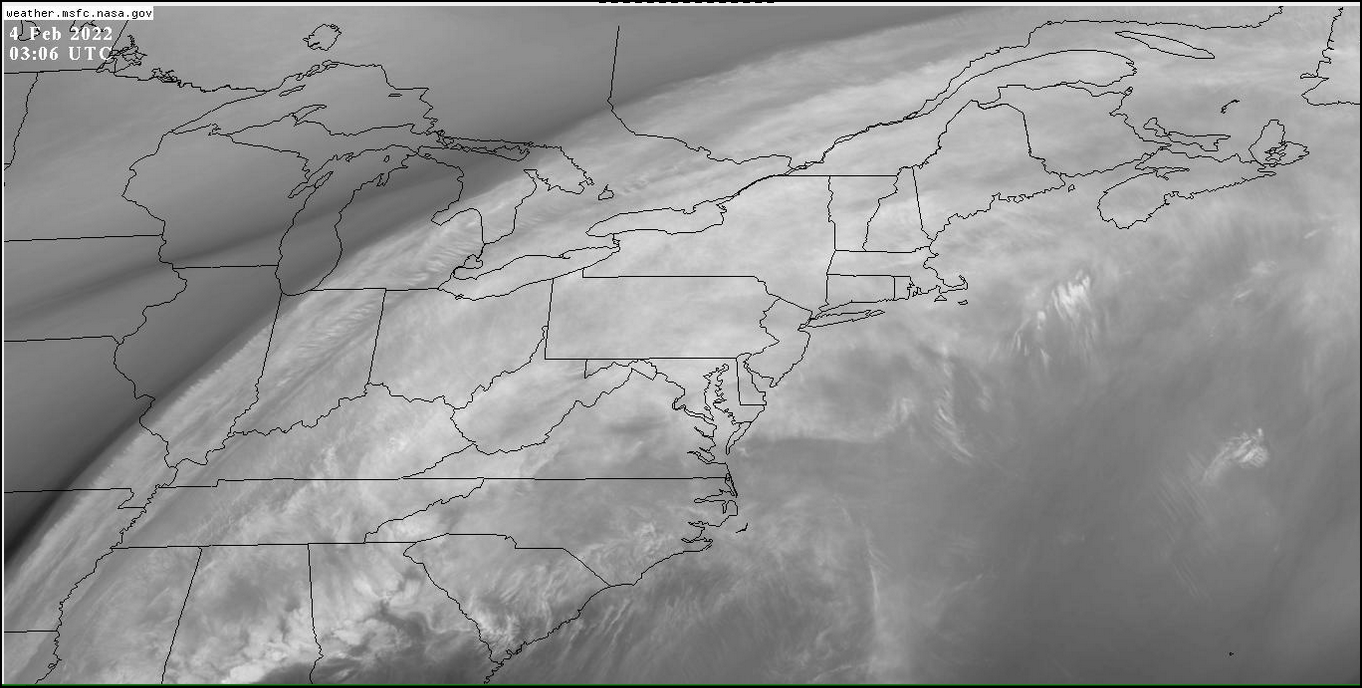
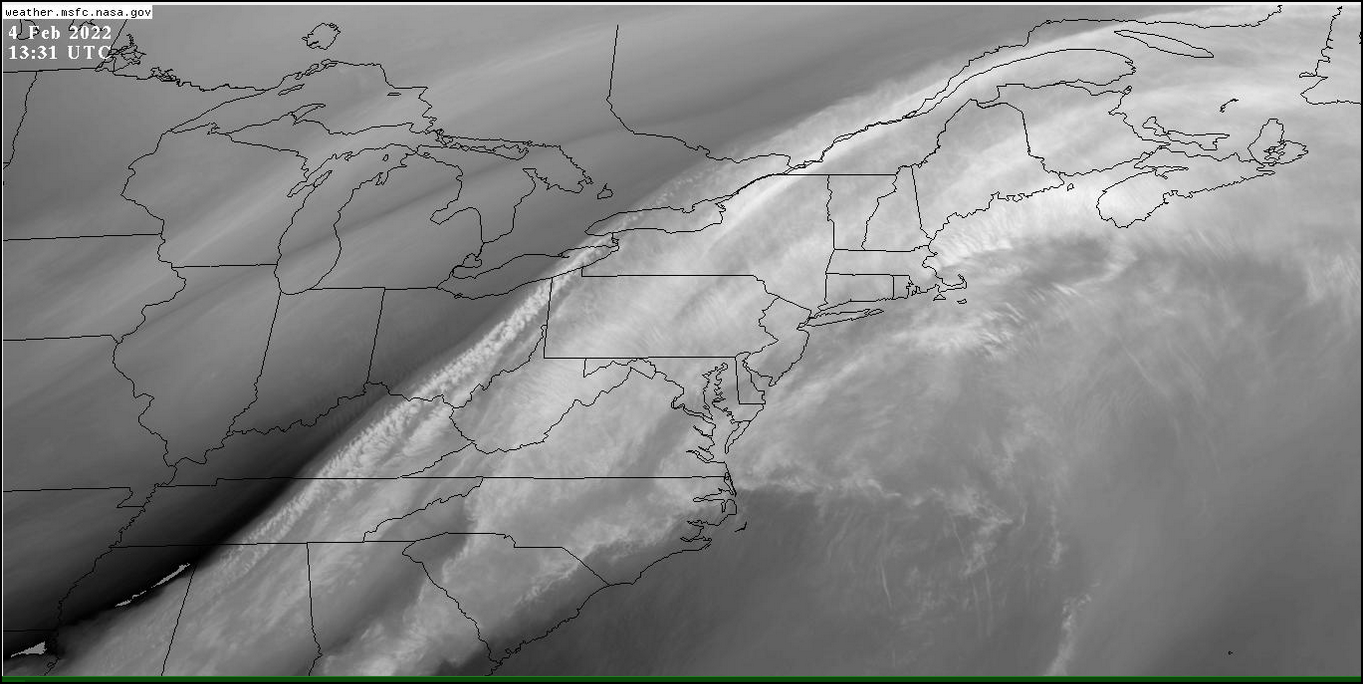
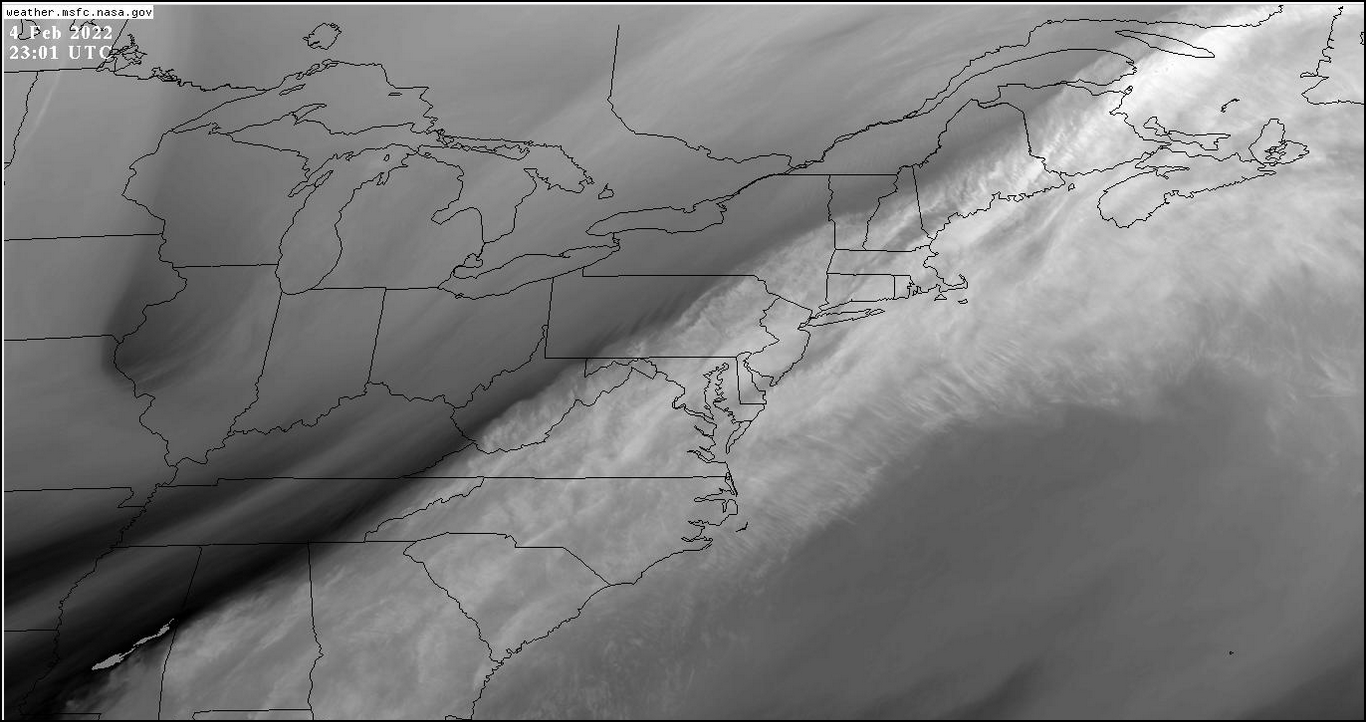
Imagery courtesy George C. Marshall Space Flight Center Earth Science Branch
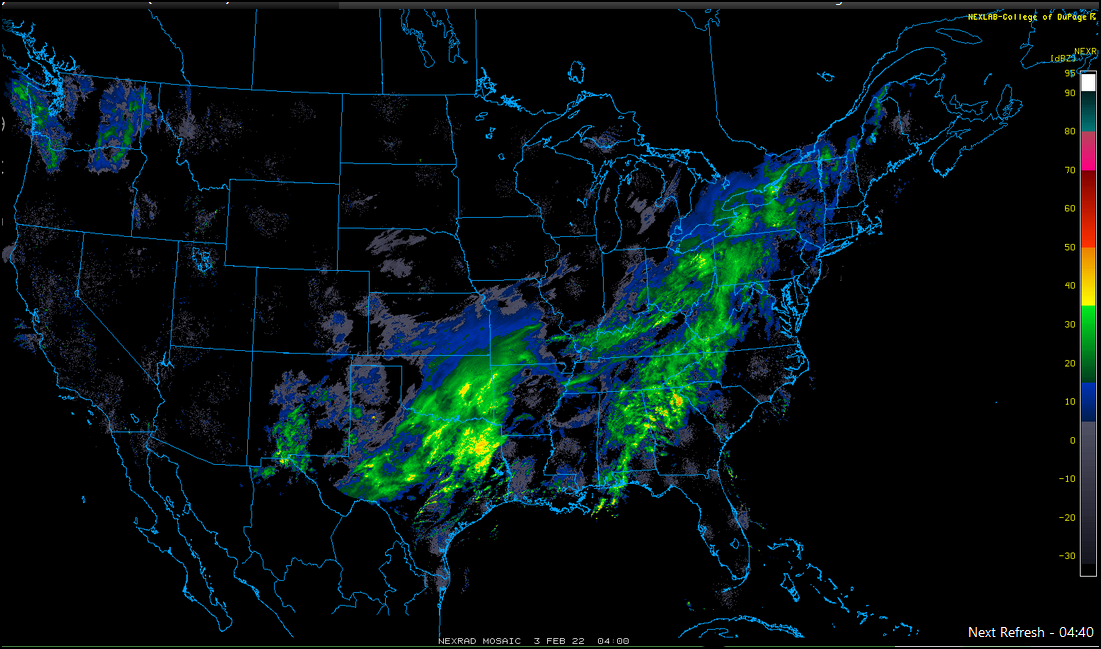
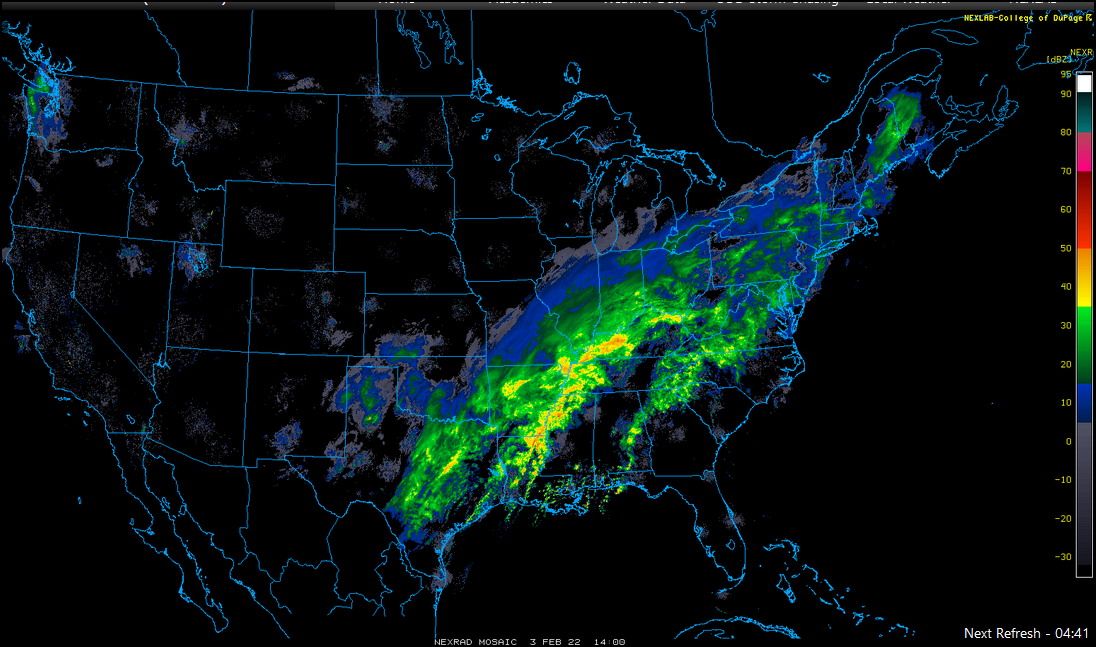
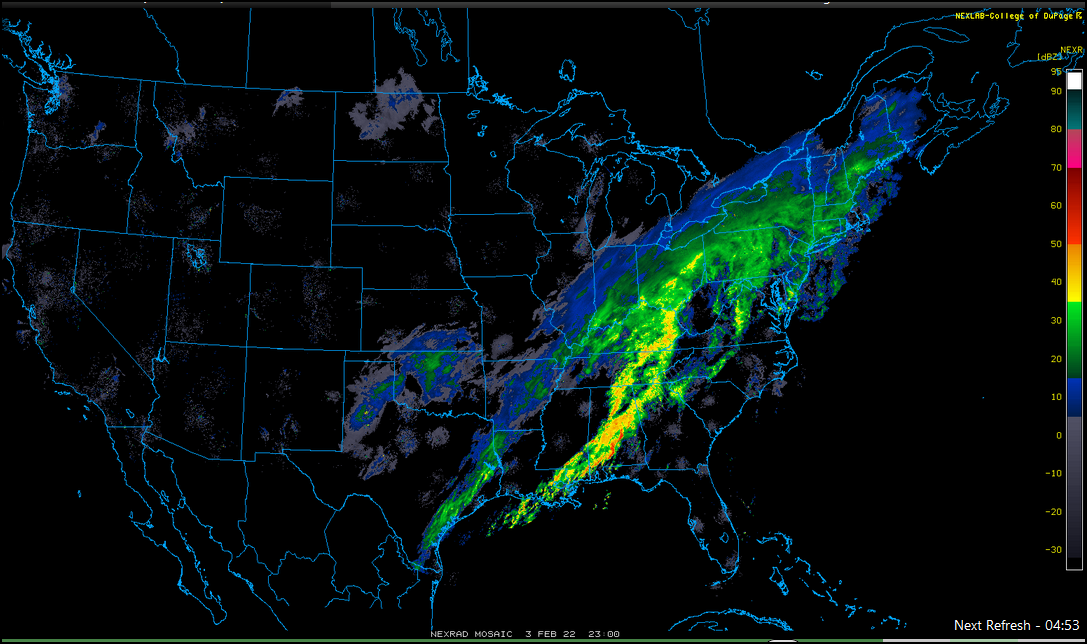
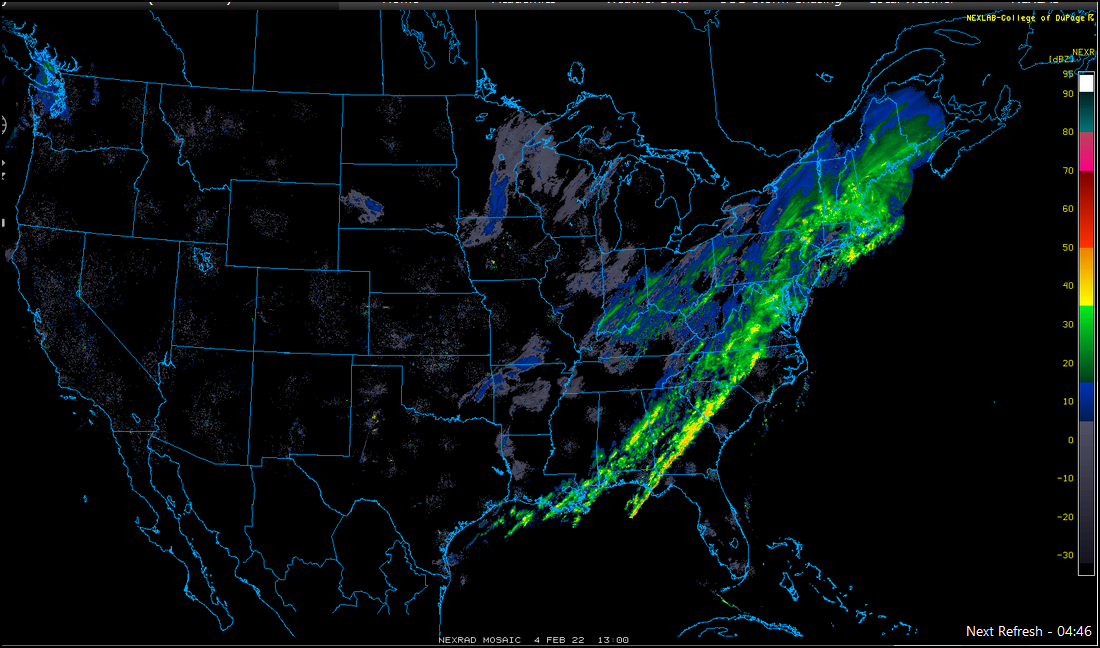
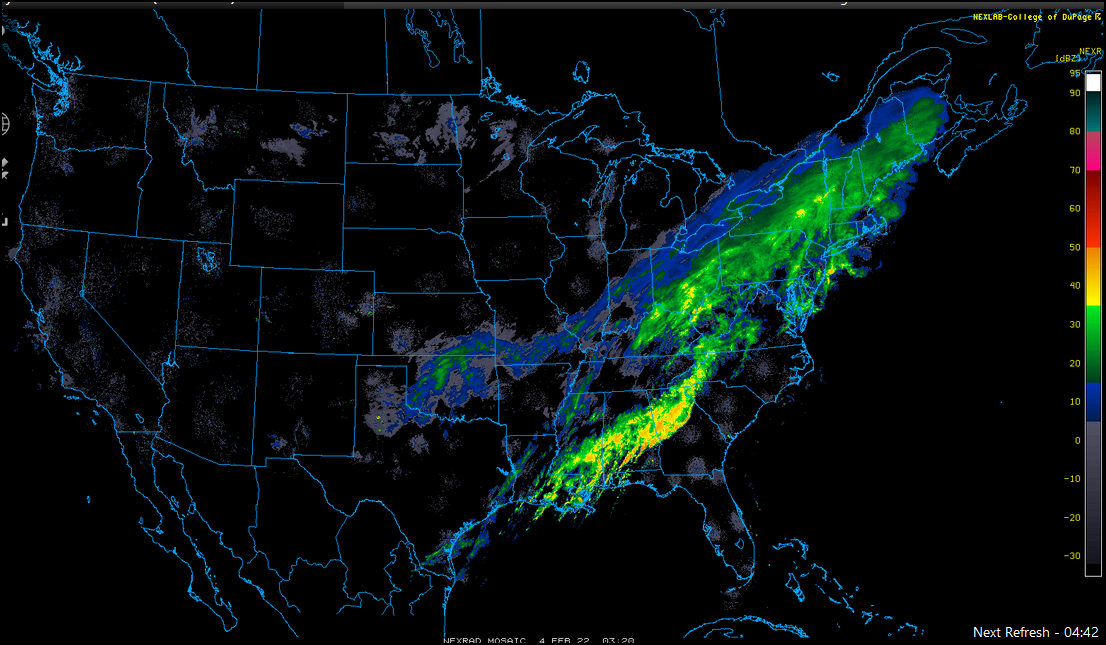
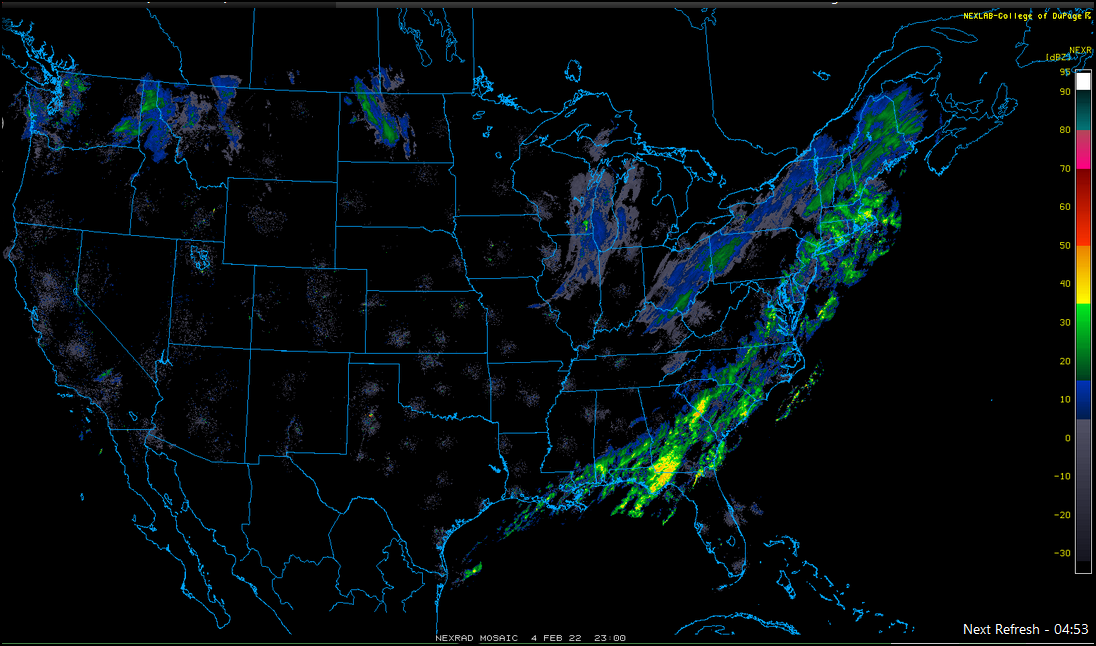
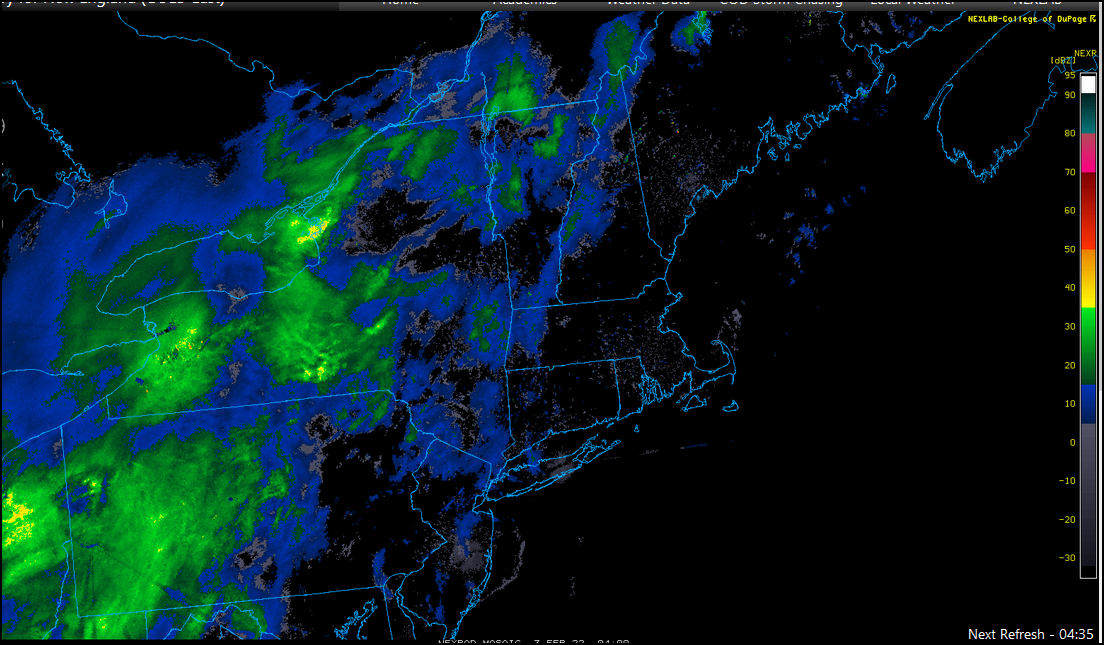
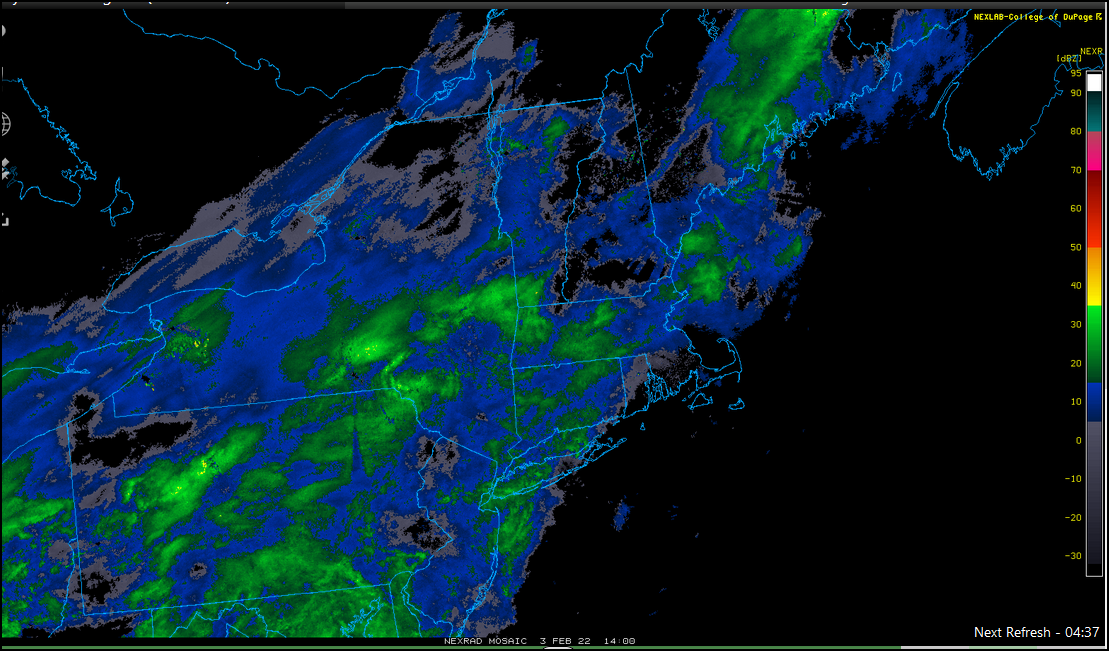
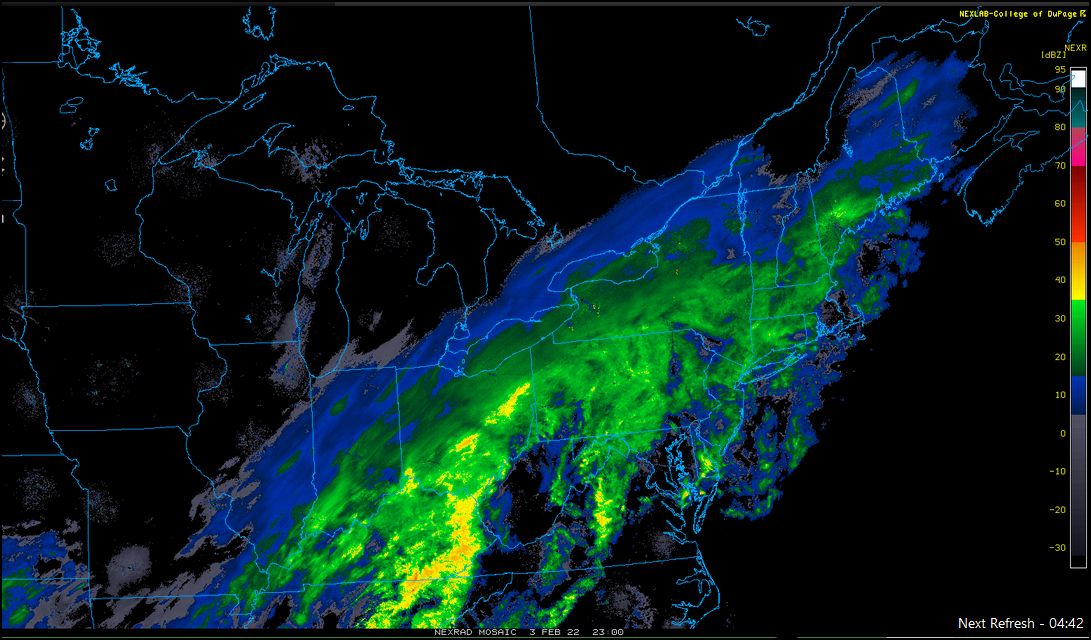
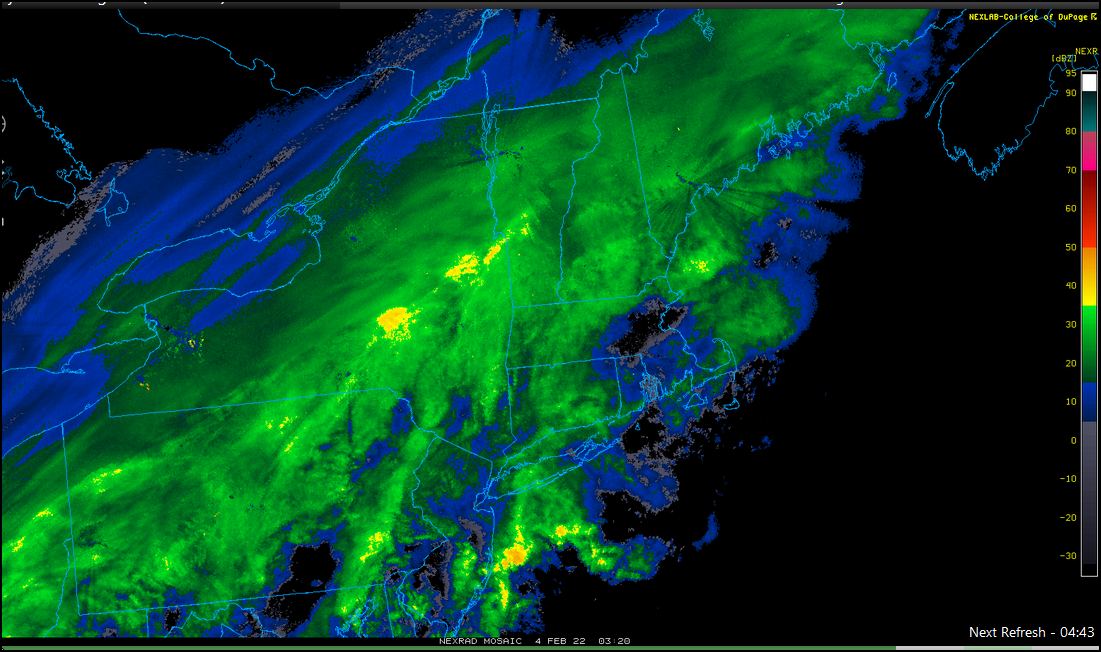
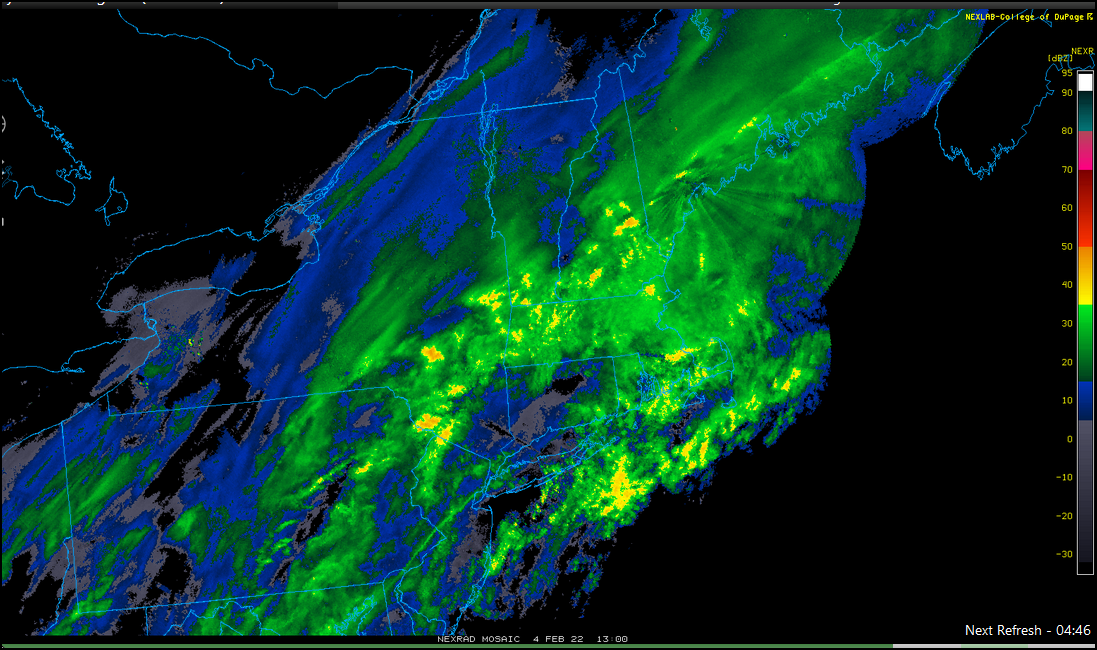
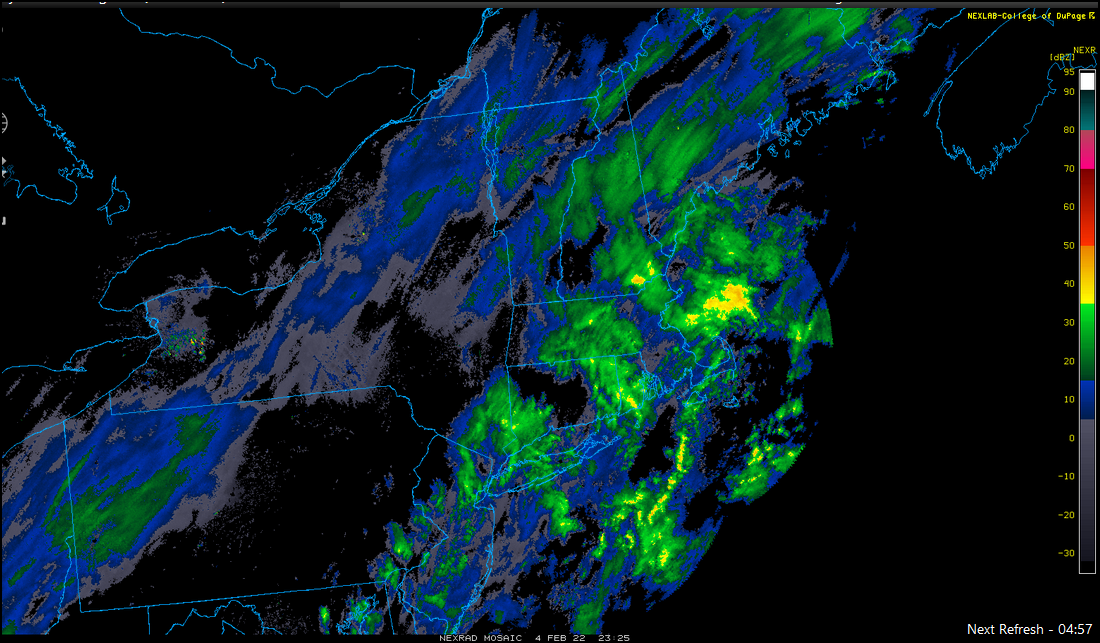
Radar imagery courtesy College of DuPage NEXLAB