Complete Results @ http://www.newx-forecasts.com/
Follow the left-side link from '22nd Annual Snow Storm Contest > Verified Forecasts > ‘31-JAN-21’ to see the complete forecasters’ verification table by station
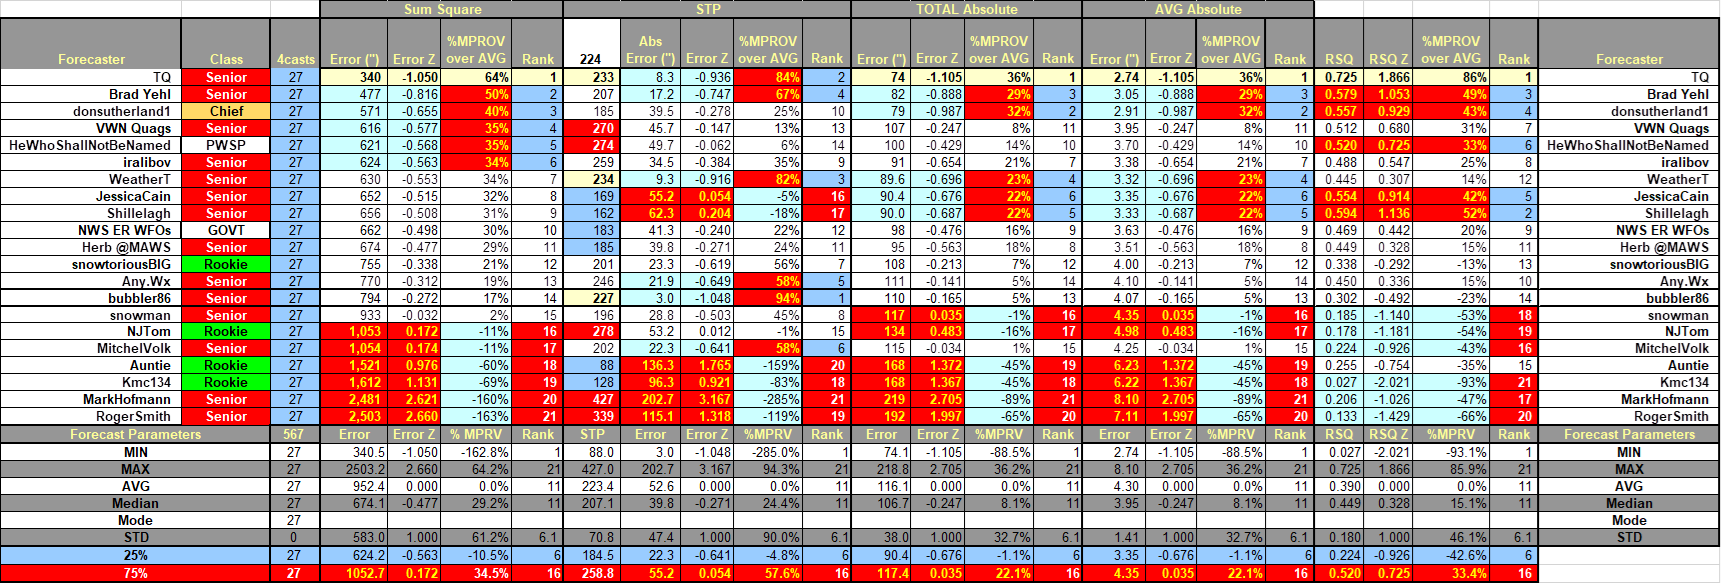
In the table ...
Yellow cells indicate the best score in category.
Forecast STP cells: yellow if within +/- 5% of observed STP.
Blue (Red) cells indicate the 25% (75%) percentile.
SUMSQ: sum of square errors (measure of forecast accuracy accounting for magnitude and distribution of snowfall)
STP: storm total precipitation
TAE: total absolute error
AAE: average absolute error
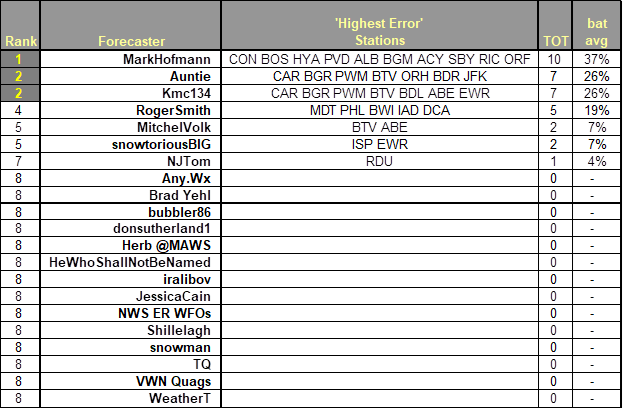
Final Standings - all Forecasters
Station by Station Comparison of Best Forecasts
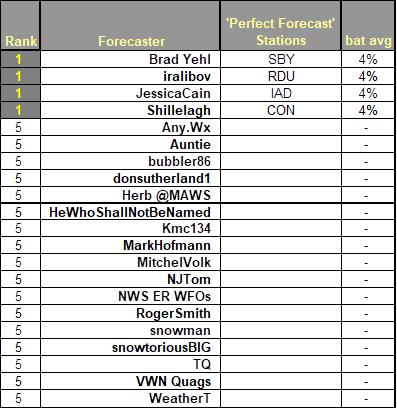
Perfect Forecasts (Batting Average - Percentage of Forecast Stations with No Error)
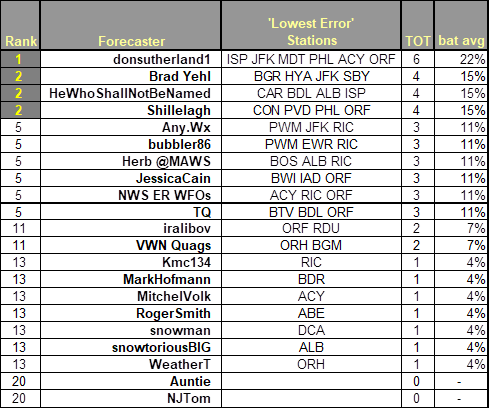
Best Station Forecasts (Batting Average - Percentage of Forecast Stations with Lowest Absolute Error)
Best Station Forecast Busts (Batting Average - Percentage of Forecast Stations with Highest Absolute Error)
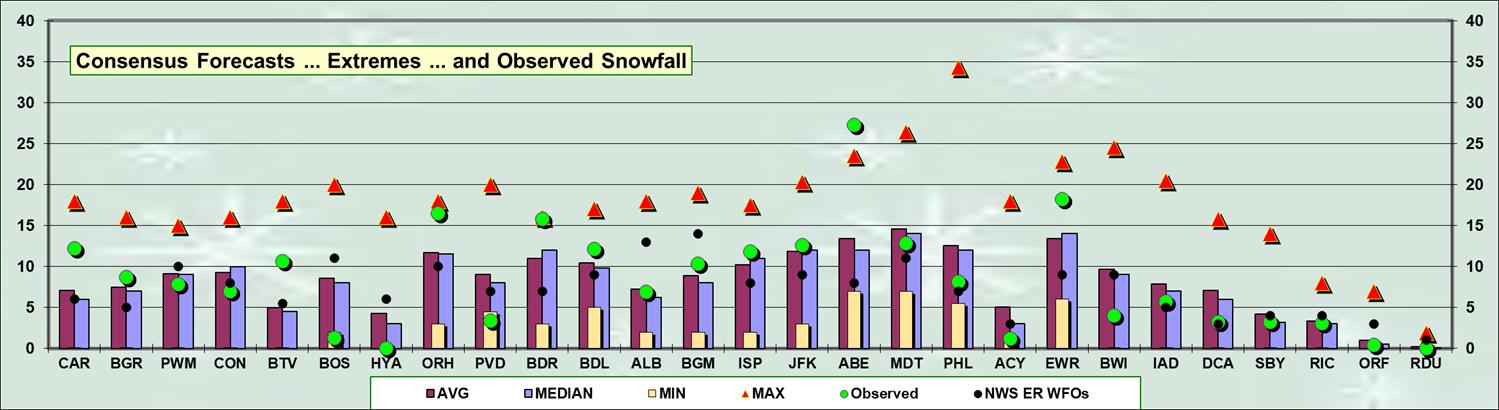
Consensus forecast best @ ALB … JFK … RIC
MAX forecast best @ ORH … BDR … ABE
MAX forecast less than observed @ ABE
MIN forecasts best @ PVD … ACY
MIN forecasts more than observed @ PVD
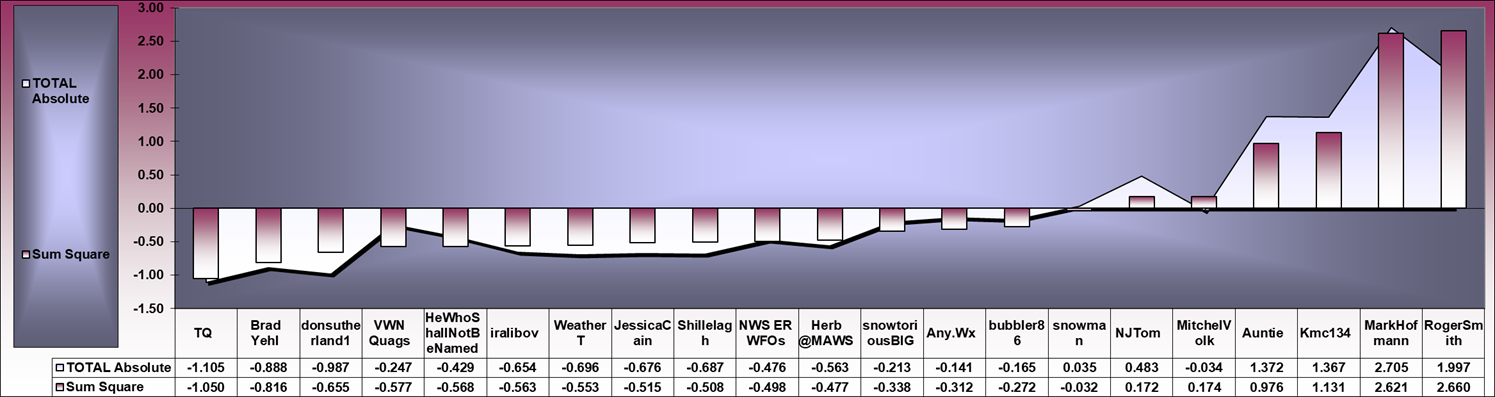
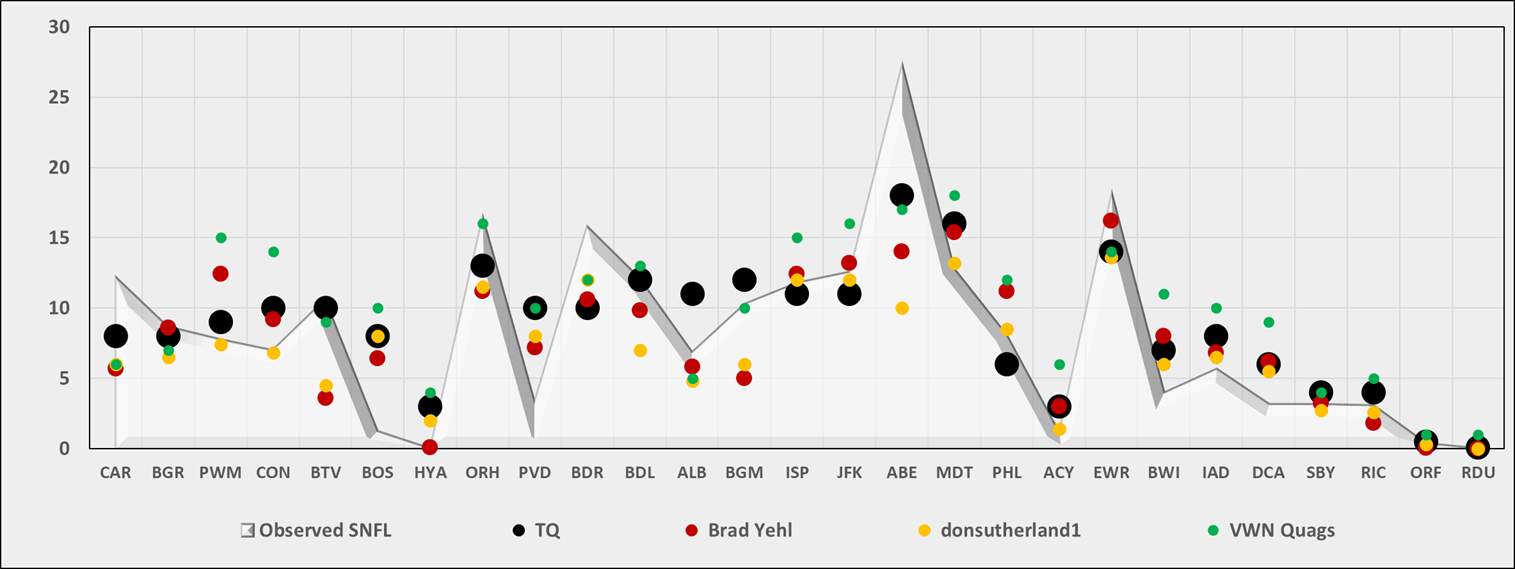
Strong correlation (R = 0.971) between SUMSQ and TAE Z-scores
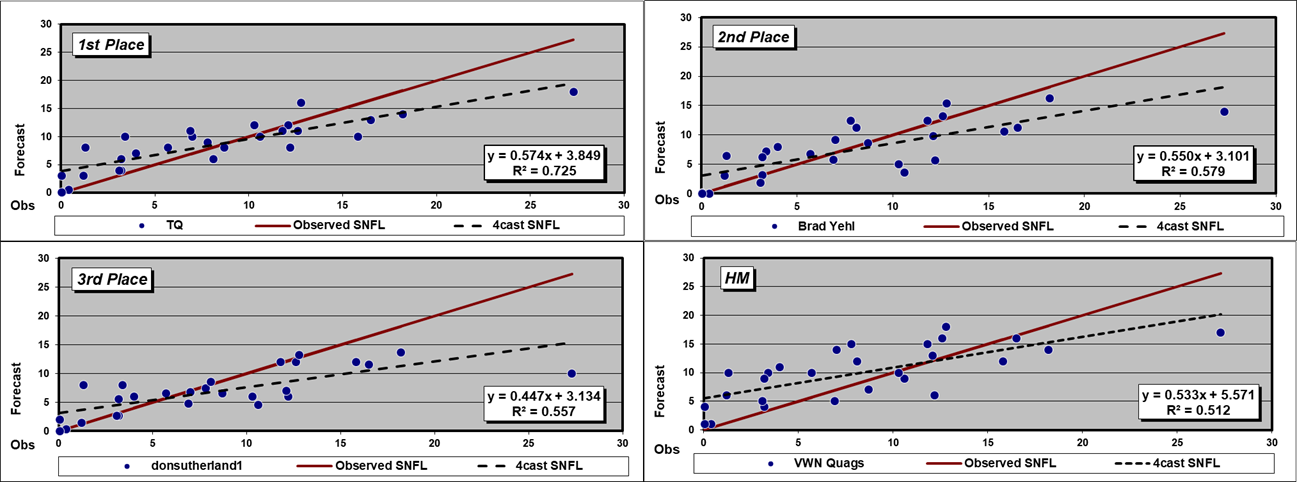
A dashed Forecast trend line above (below) solid red Observed snowfall line ==> over (under) forecast
R2 value indicates how well the forecast captured the observed snowfall’s variability … i.e., R2 = 0.874 ==> the forecast captured ~87% of the observed snowfall’s variability.
*******************************
Storm-total snowfalls for SUN 31-JAN-21 thru WED 04-FEB-21 from CDUS41 (CLI) ... CXUS51 (CF6) ... METARs ... and PNS bulletins.
Excellent coverage and reporting.
HYA STP based on METAR's present weather and hourly P-group data.
SBY STP estimated by applying inverse
distance weighting interpolation technique using four timely reports carried
by the AKQPNS bulletin within 6 SM of the station.
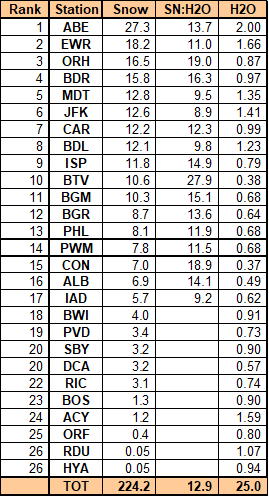
Average forecast area snow-to-liquid ratio (SN:H20) weighted by station accumulation.
SN:H20 not reported for some stations with measurable snowfall b/c significant liquid and / or freezing precipitation also occurred during the verification period.
---
Stations observing at least 0.1": 25 (93%)
Given a station had measurable snowfall; stations observing at least ...
4" - 18 (67%)
8" - 13 (48%)
12" - 8 (30%)
18" - 2 (7%)
24" - 1 (4%)
MAX snow melt-water (minimum SLR 8:1)
ABE: 2"
EWR: 1.66"
JFK: 1.41"
MAX liquid precipitation (frozen + freezing + liquid):
ABE: 2"
EWR: 1.66"
ACY: 1.59"
---
New daily record(s)
31-JAN-21
BWI - 3.8" (3.7"; 1985)
01-FEB-21
ABE - 22.4" (7.2"; 1957)
BDR - 15.2" (4.4"; 1957)
EWR - 15.1" (7.5"; 1957)
JFK - 11.9" (1.7"; 2011)
BDL - 11.7" (5.9"; 2011)
ISP - 10.3" (0.6"; 2011)
BGM - 4.8" (4.3"; 2011)
IAD - 2.5" (1.5"; 1966)
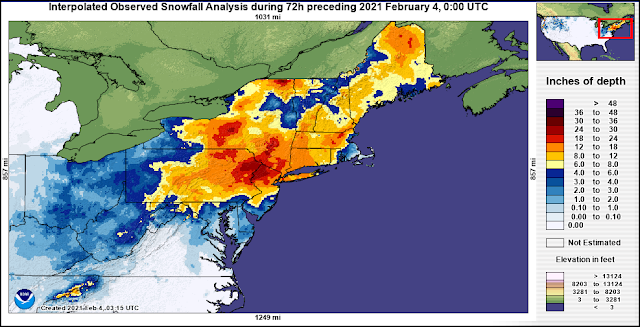
Approximate storm-total snowfall courtesy NOHRSC
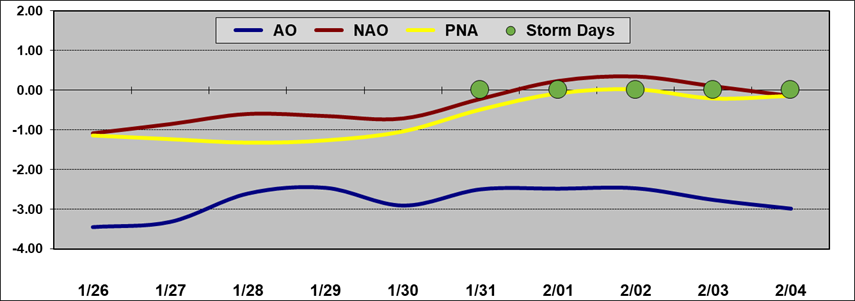
Teleconnection time-series data courtesy CPC
Surface analysis courtesy DOC / NOAA / NWS / NCEP / WPC
Upper air charts courtesy University of WY
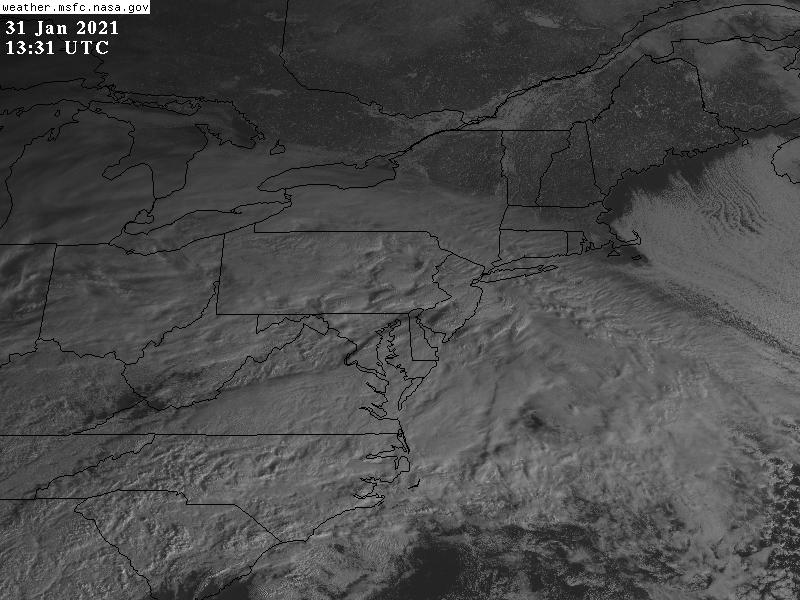
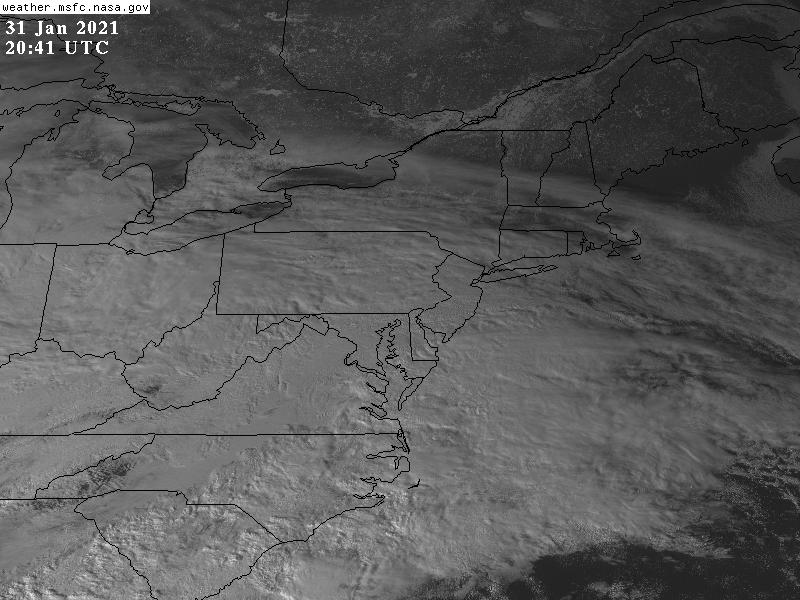
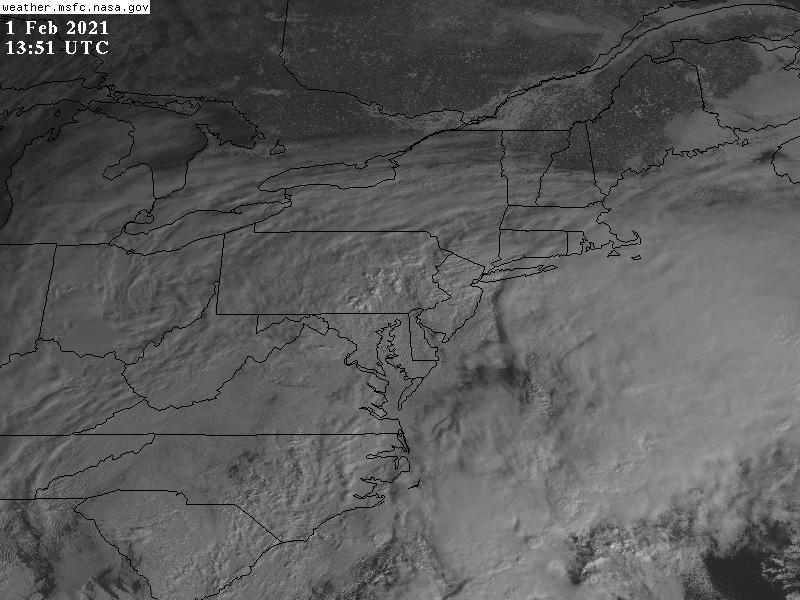
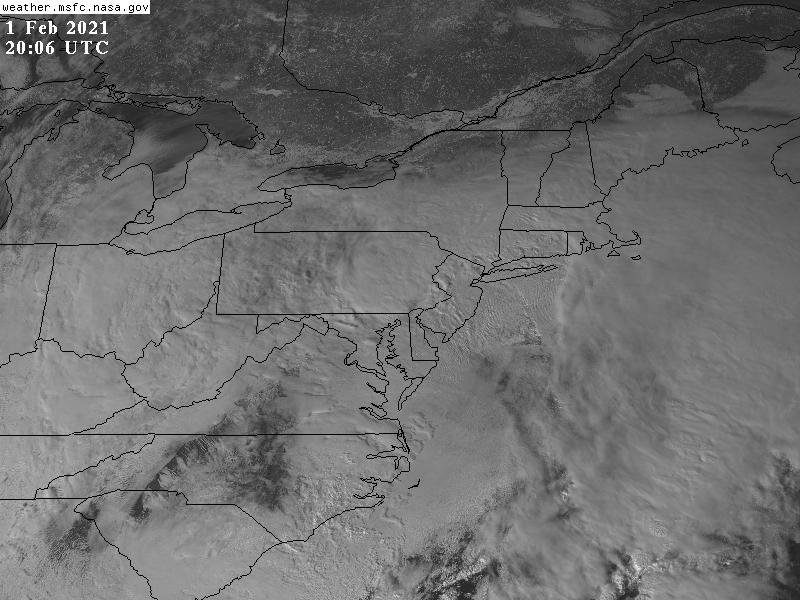
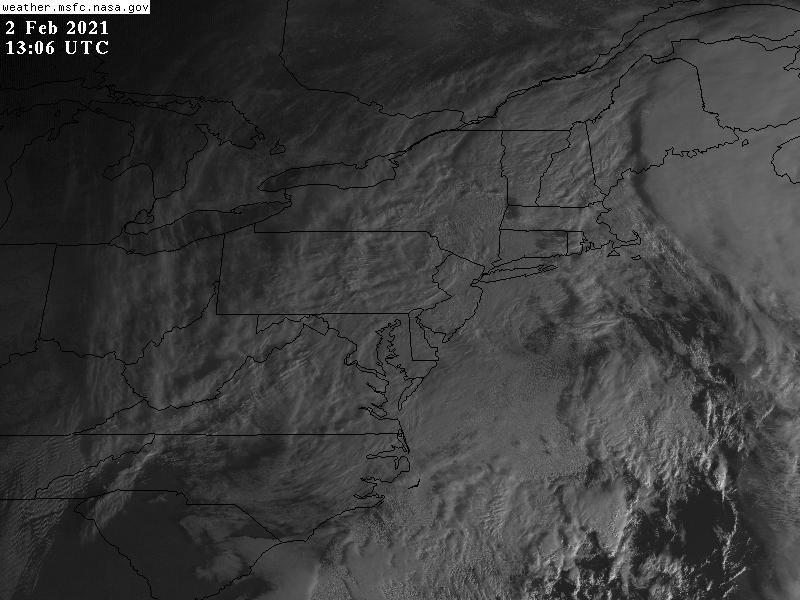
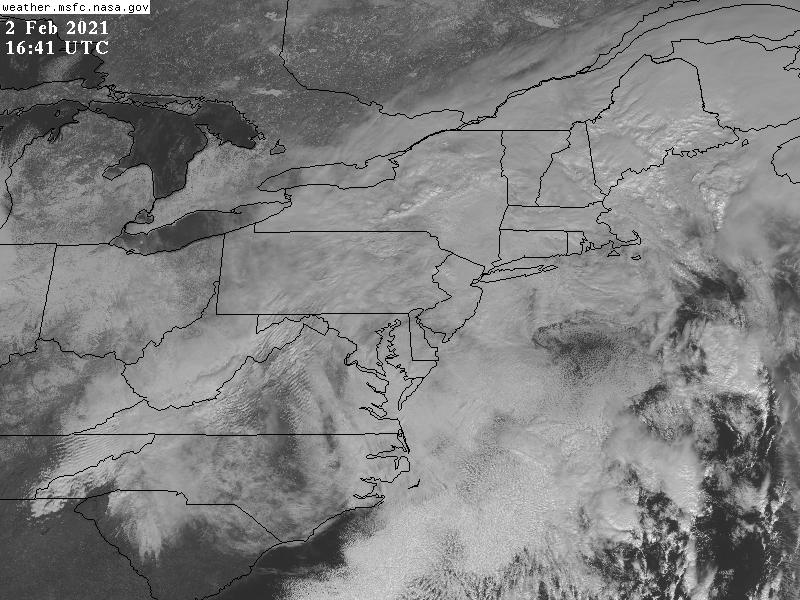
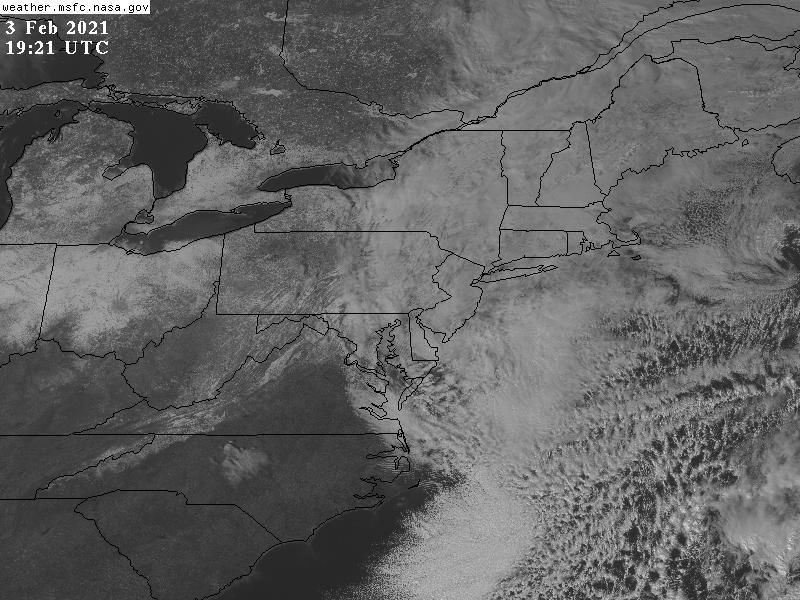
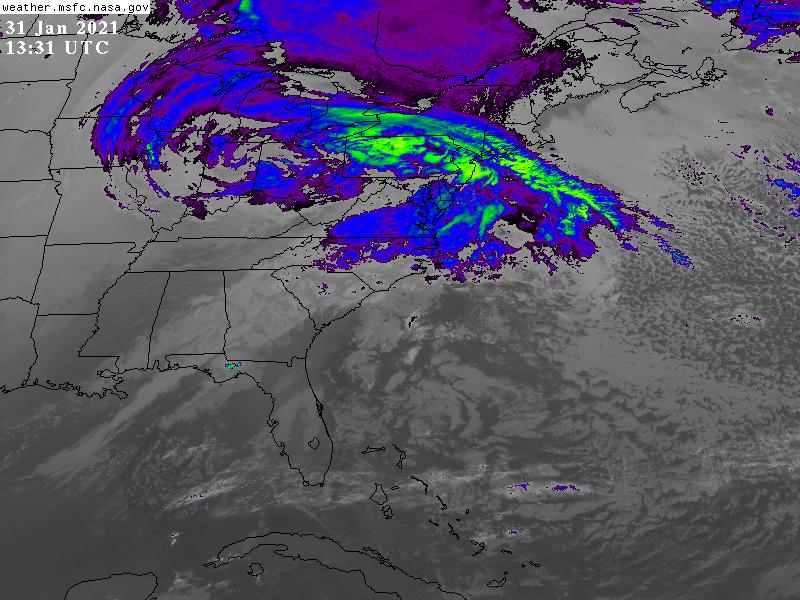
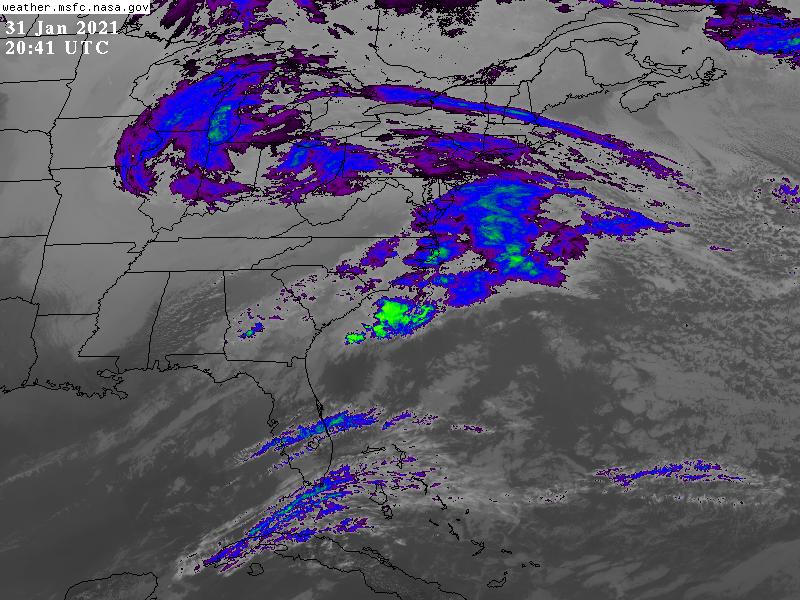
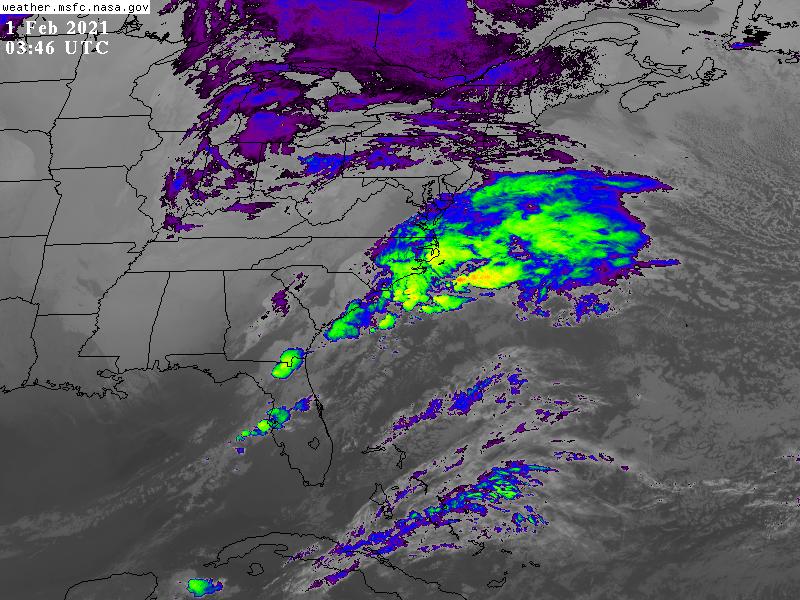
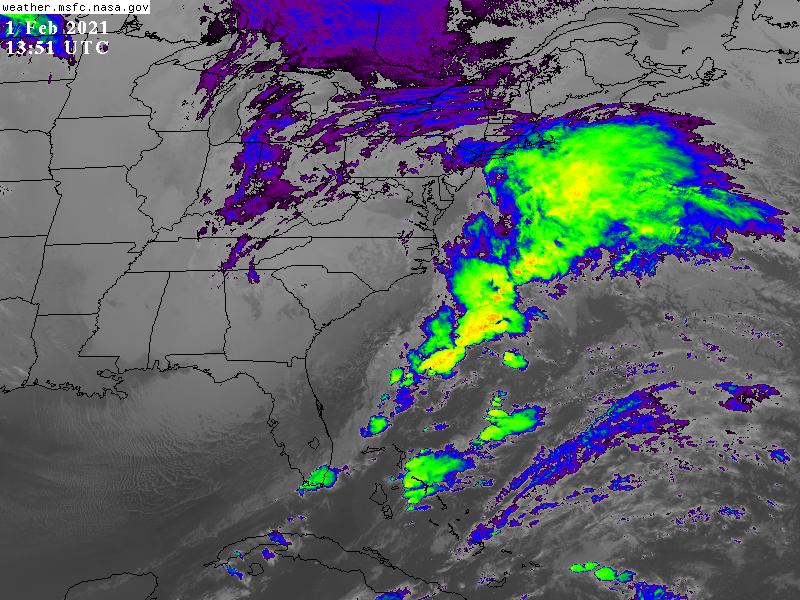
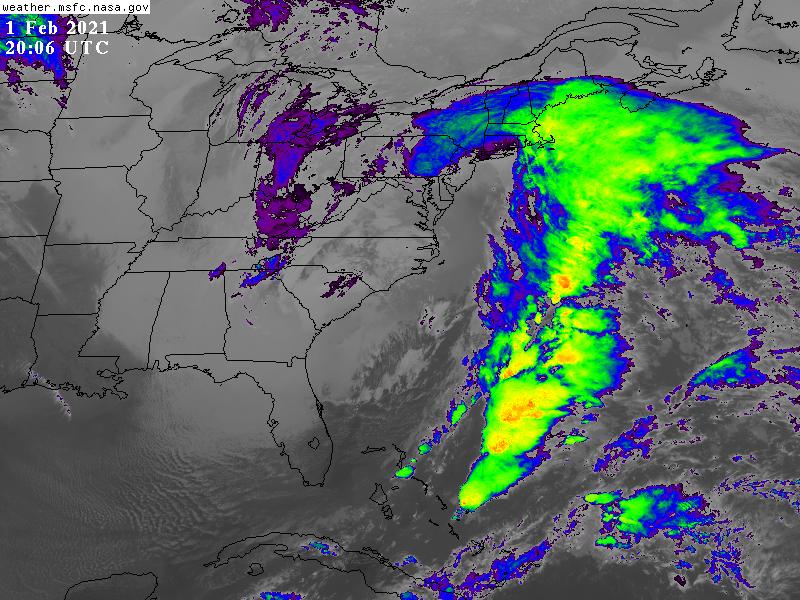
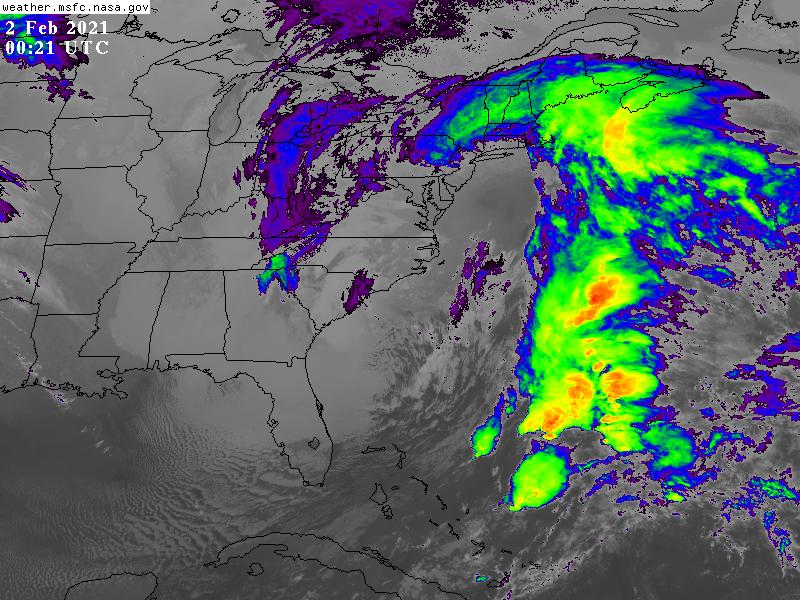
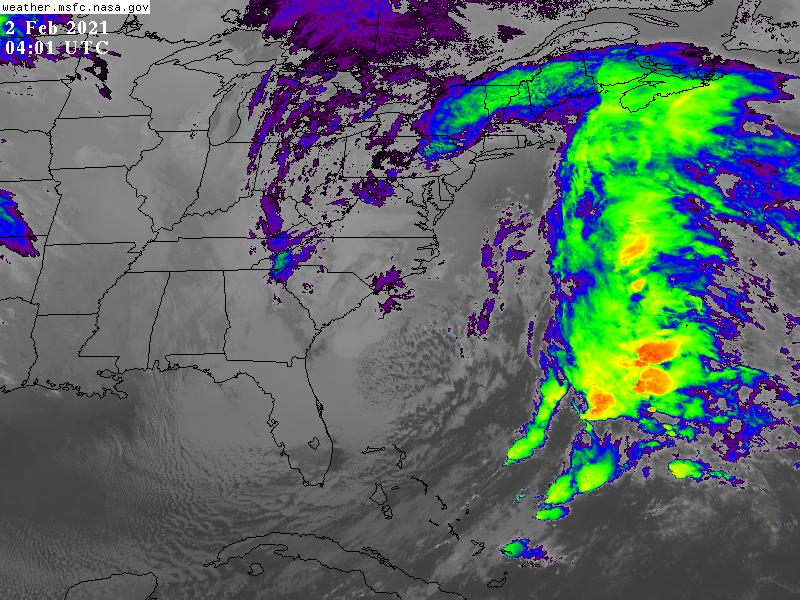
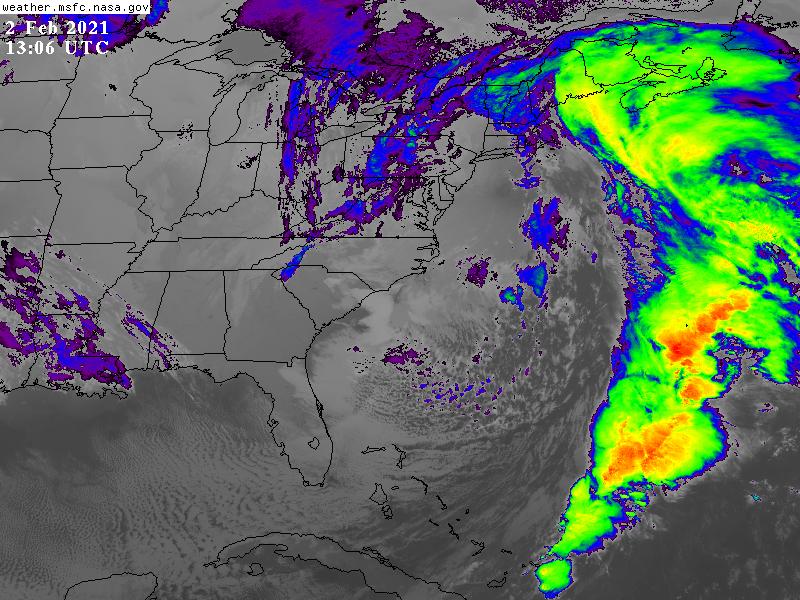
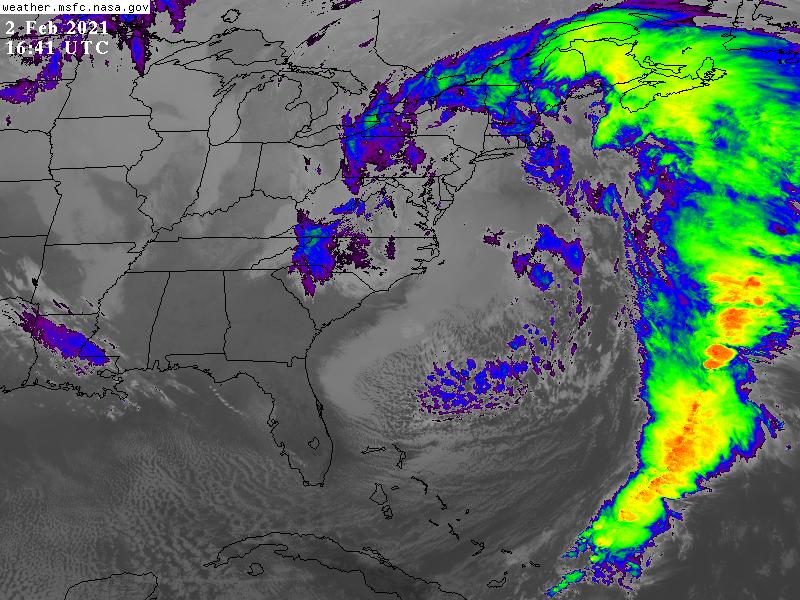
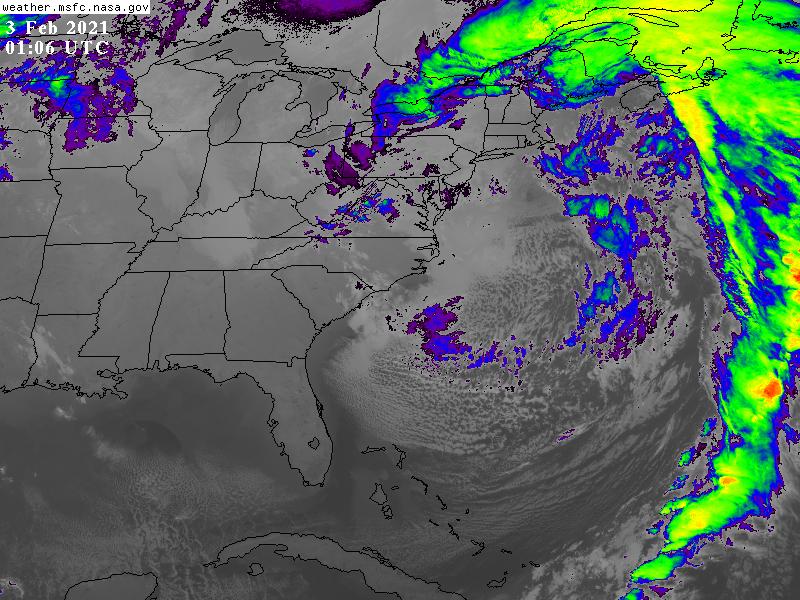
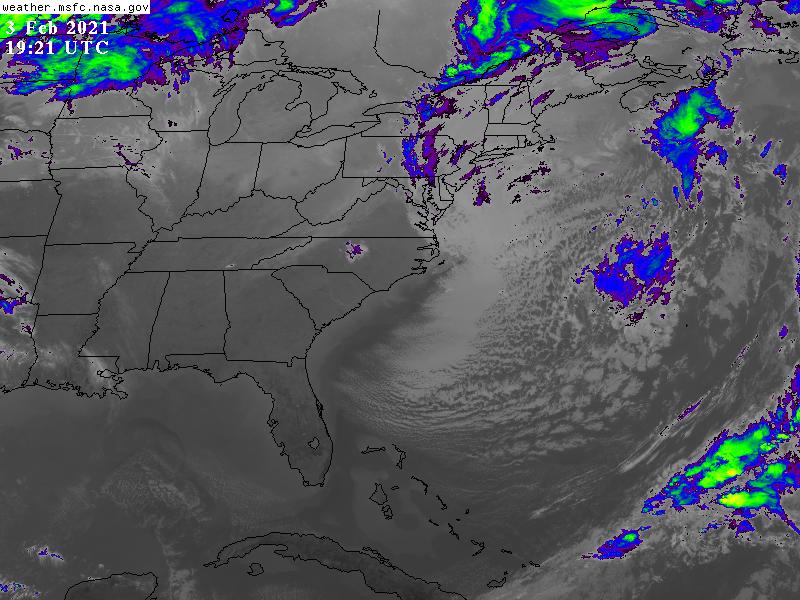
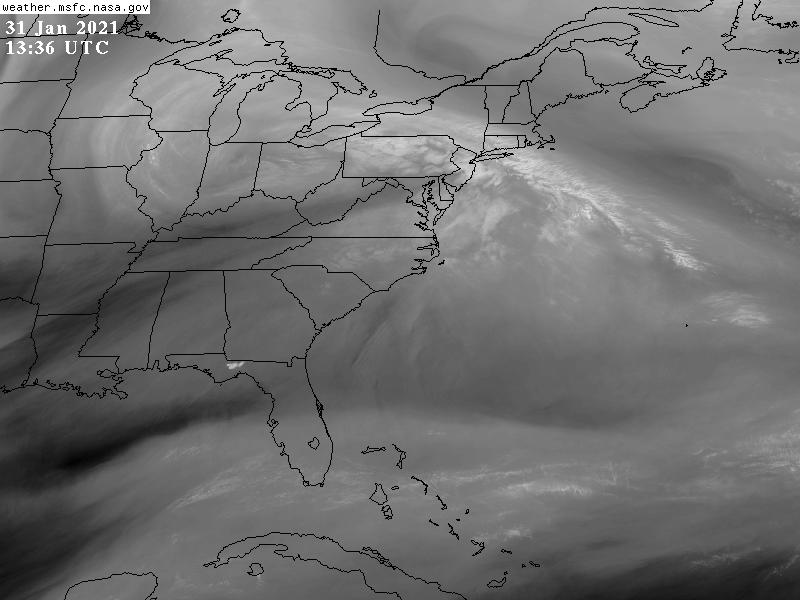
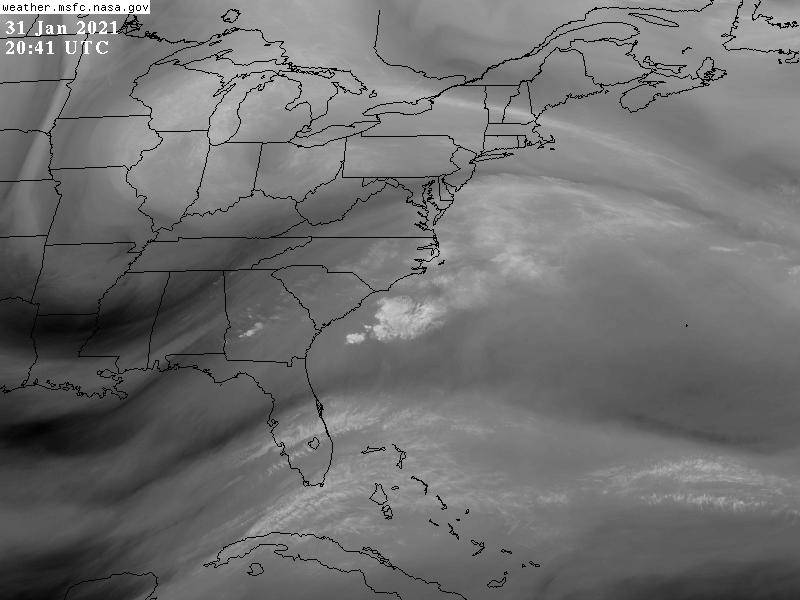
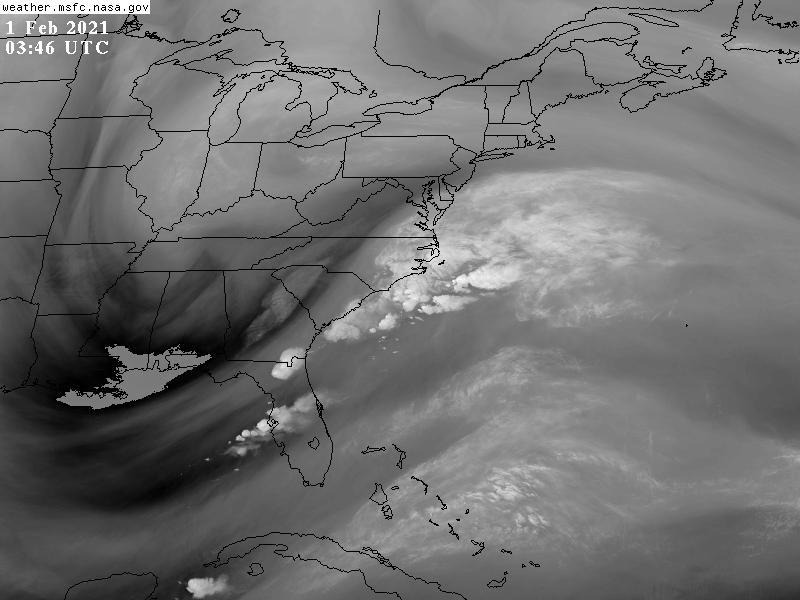
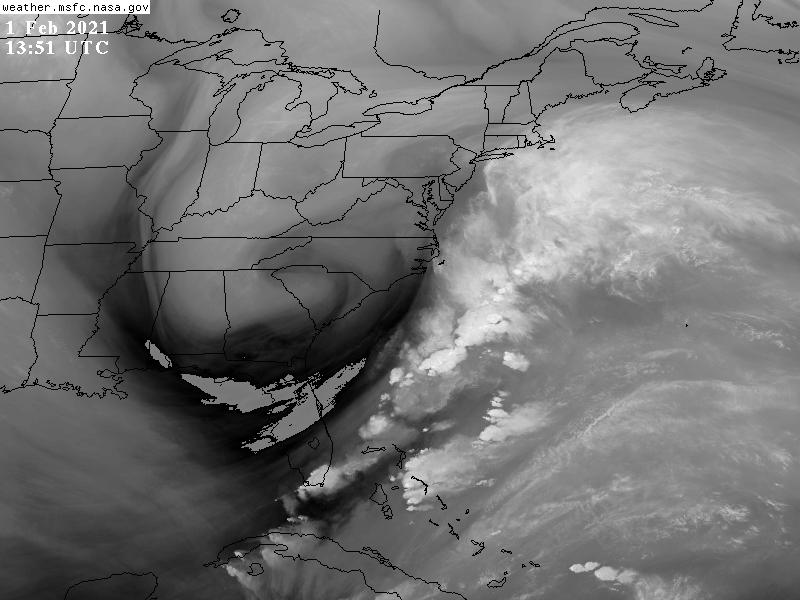
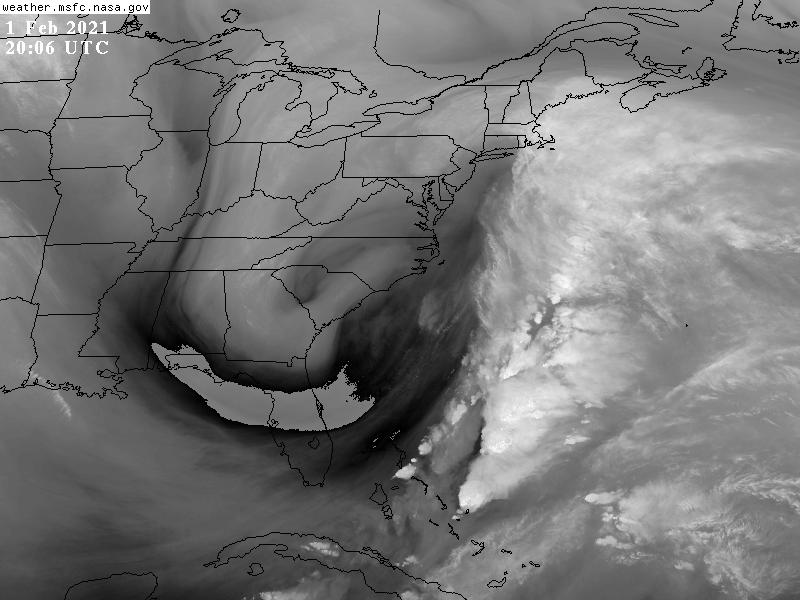
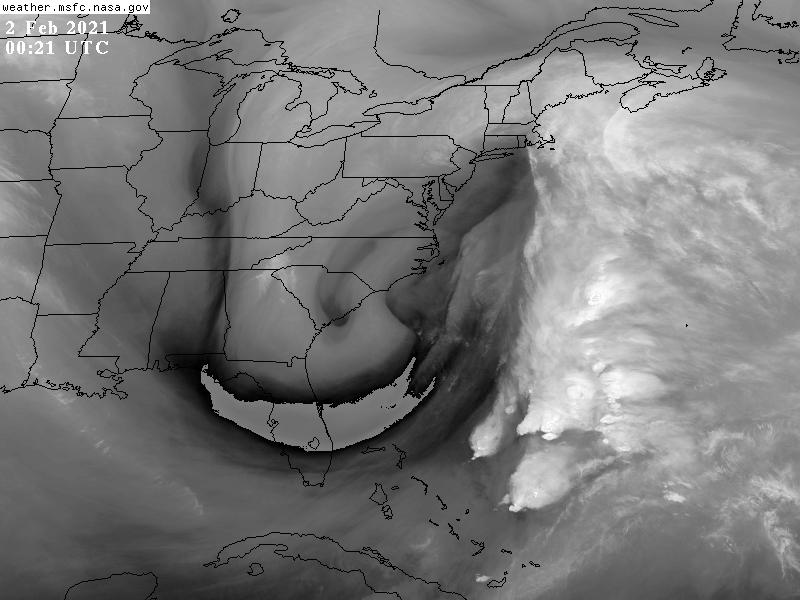
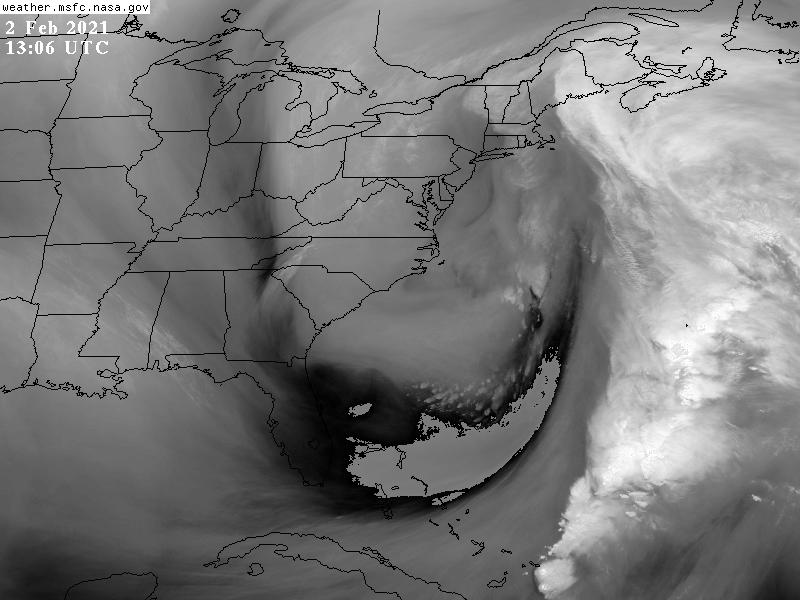
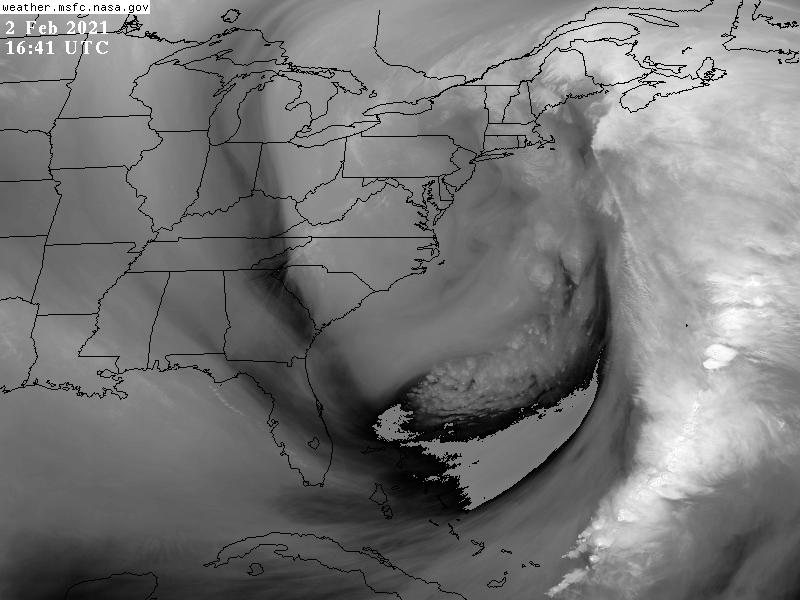
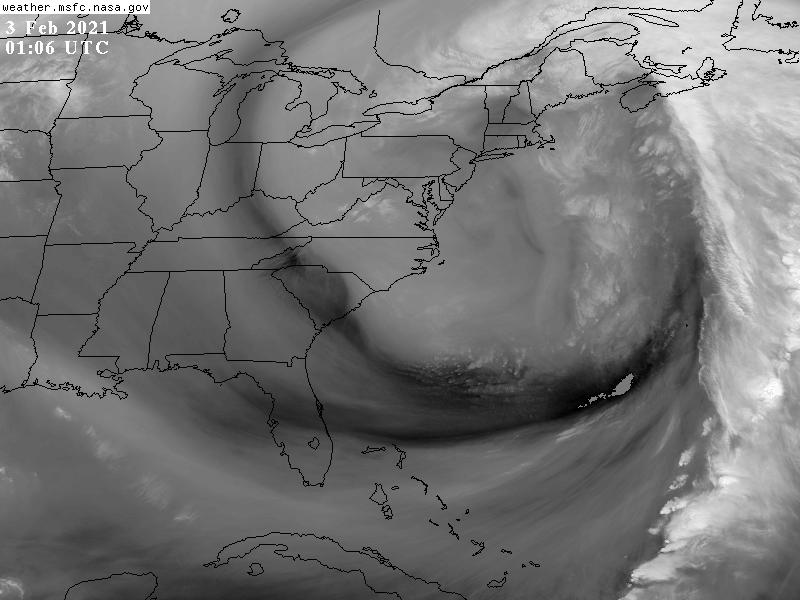
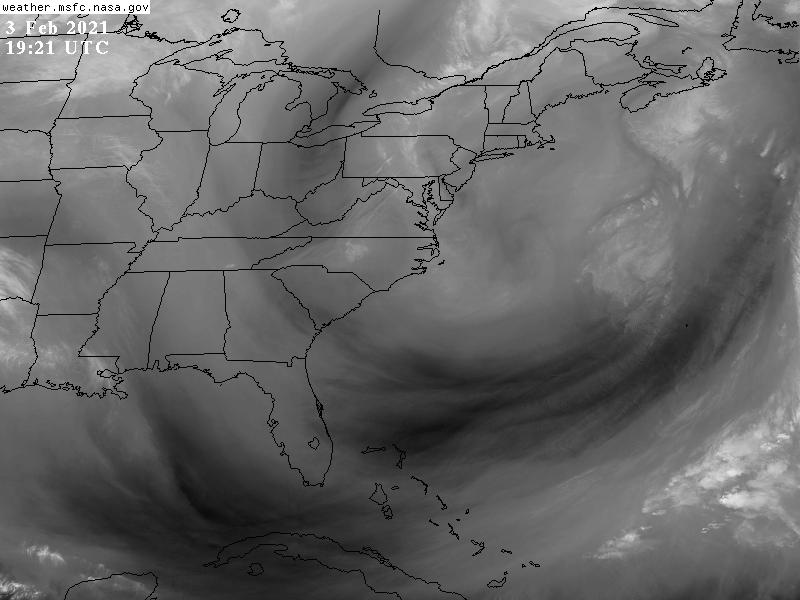
Imagery courtesy George C. Marshall Space Flight Center Earth Science Branch
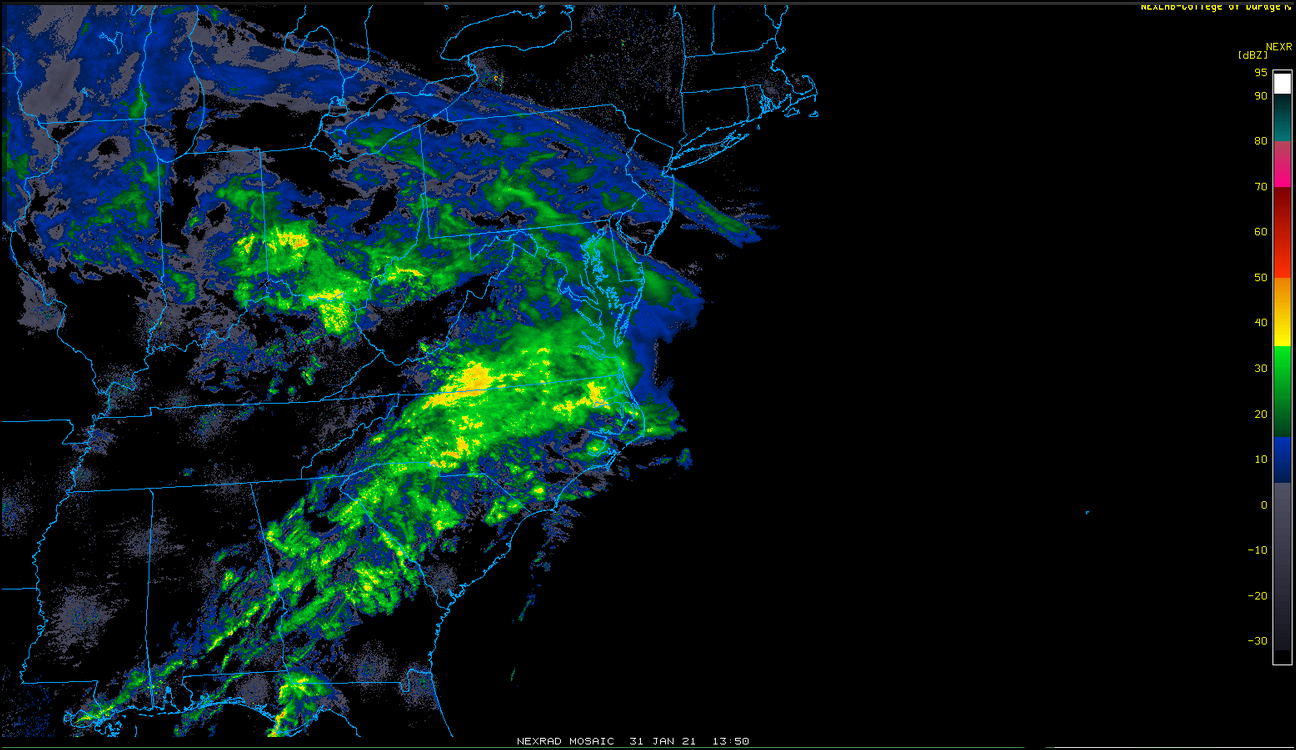
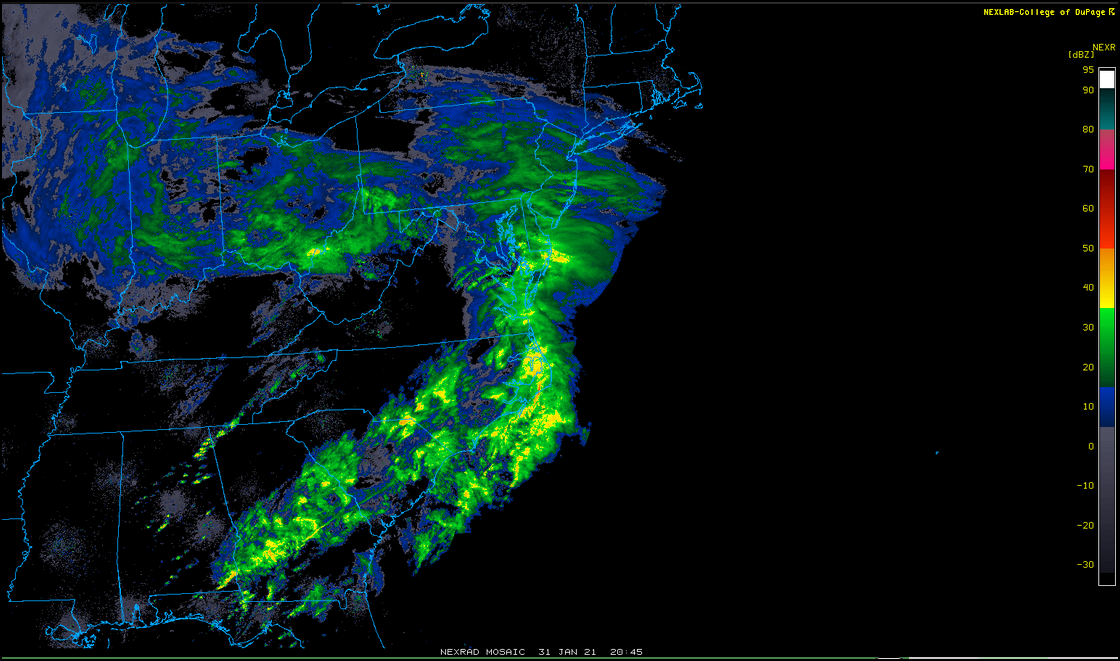
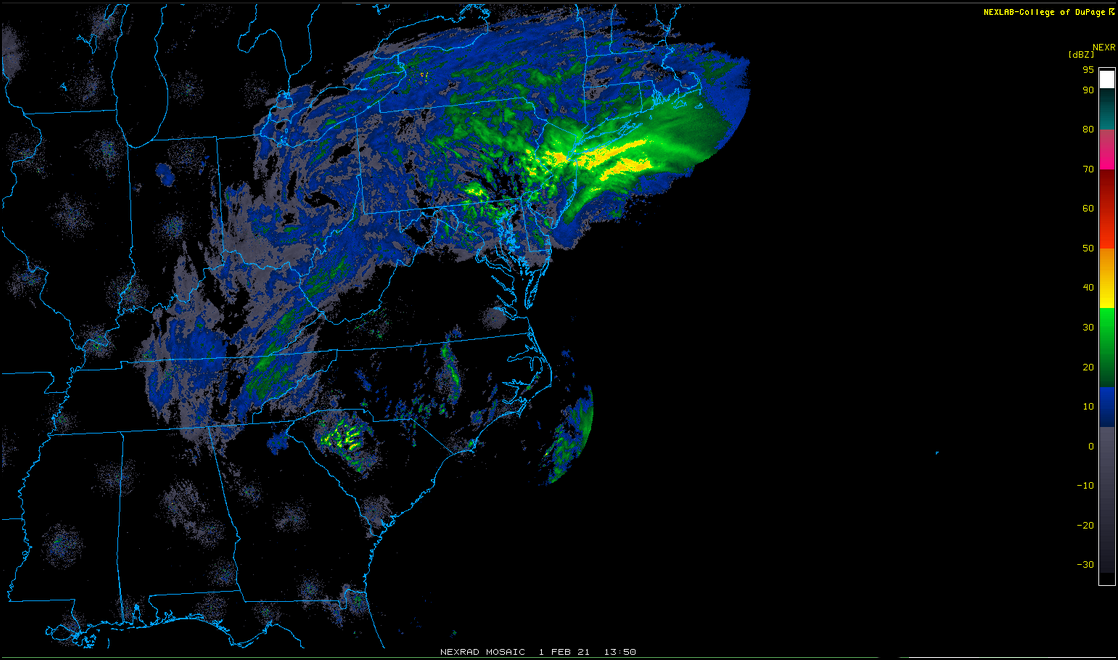
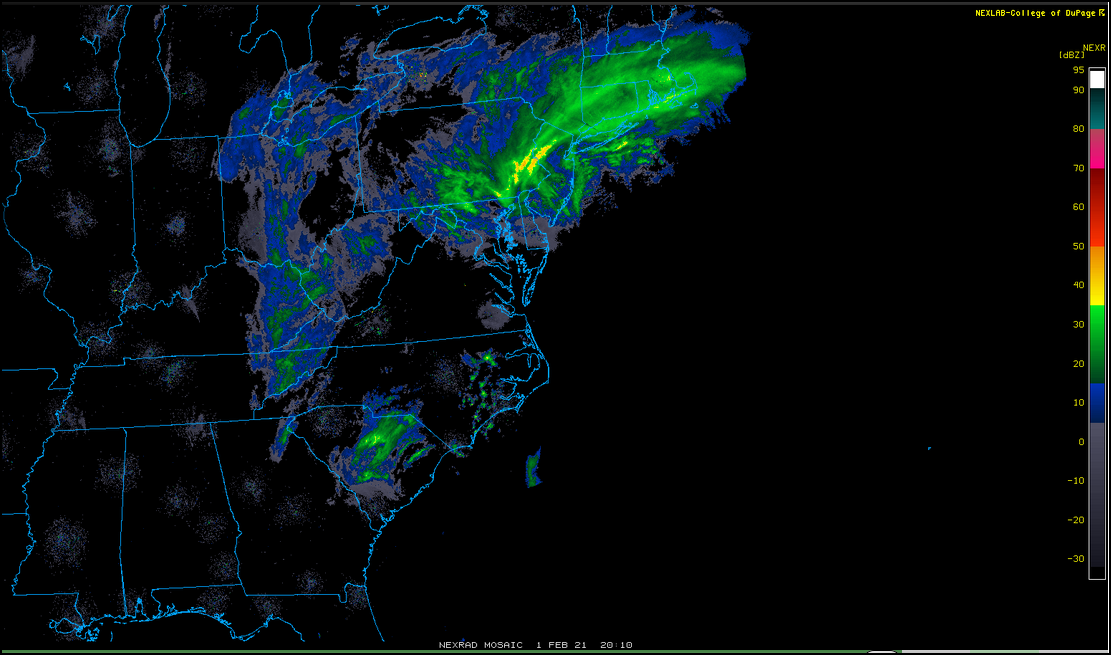
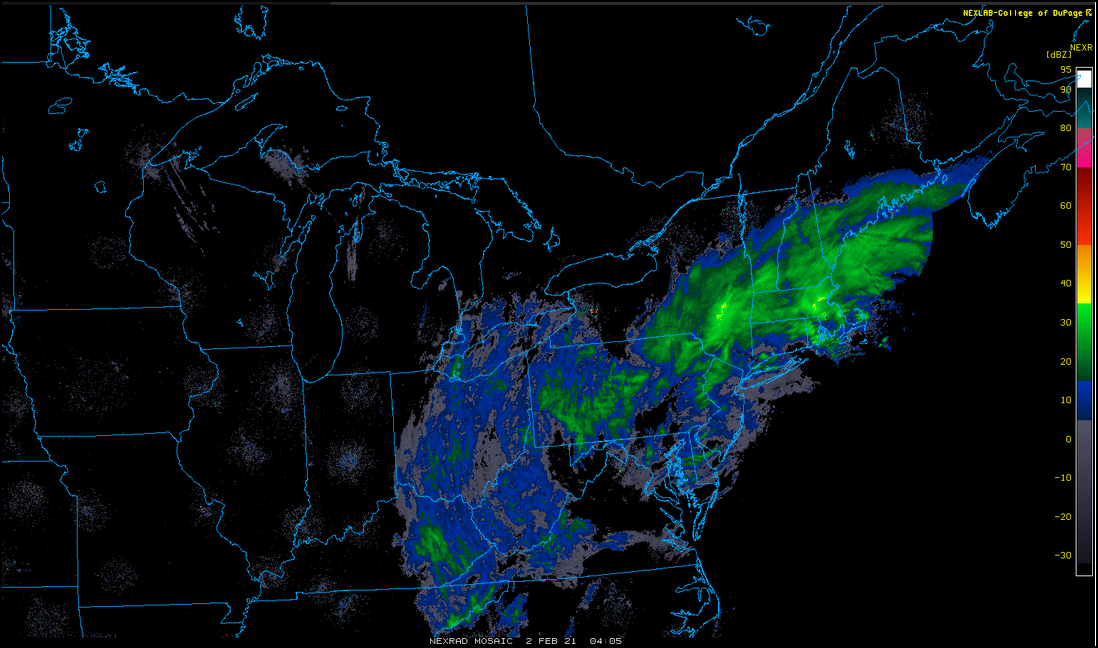
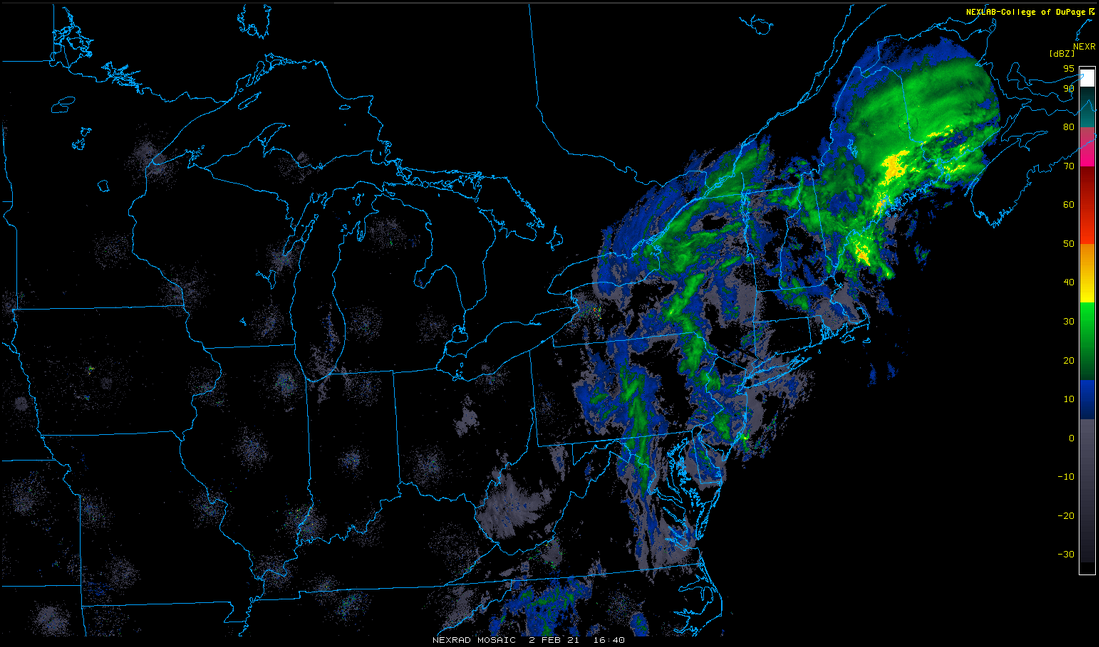
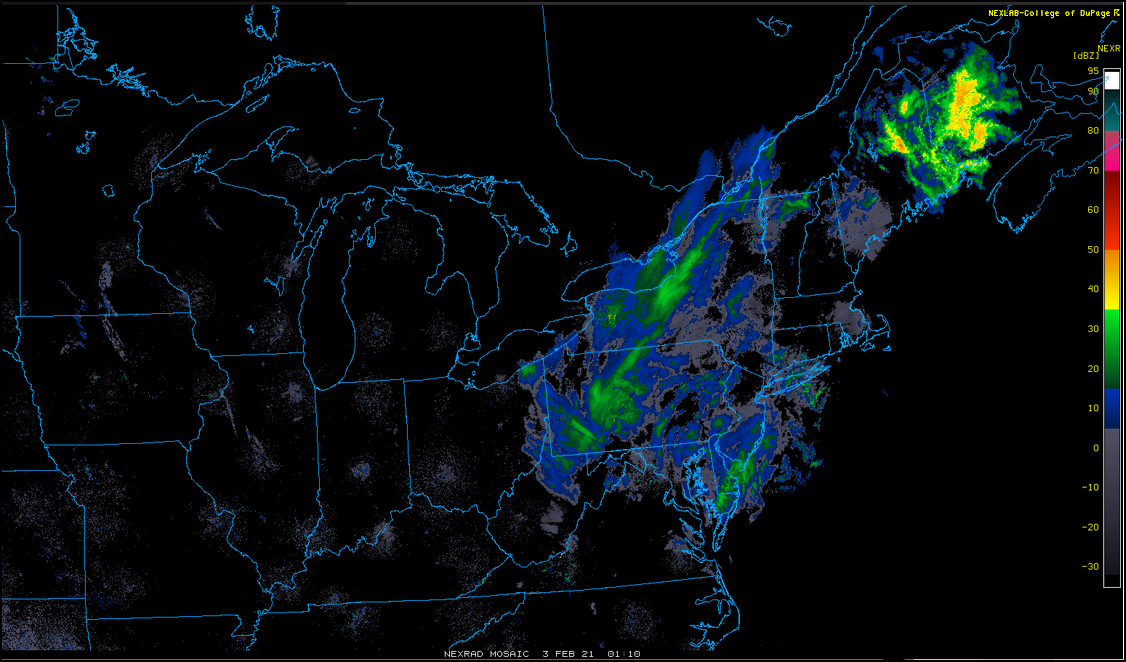
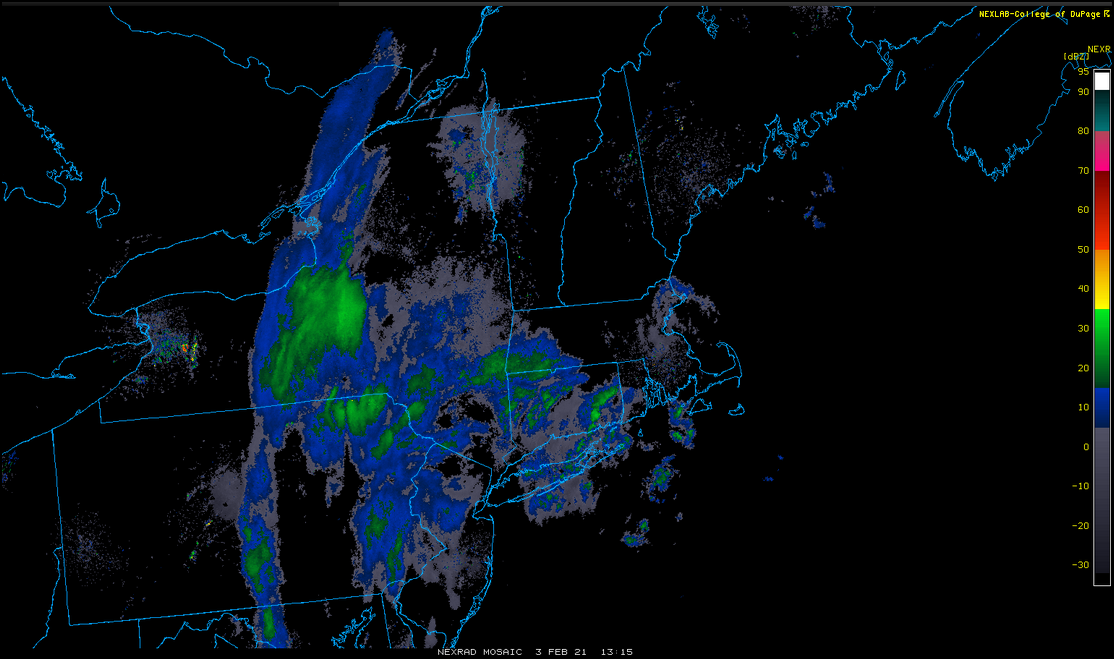
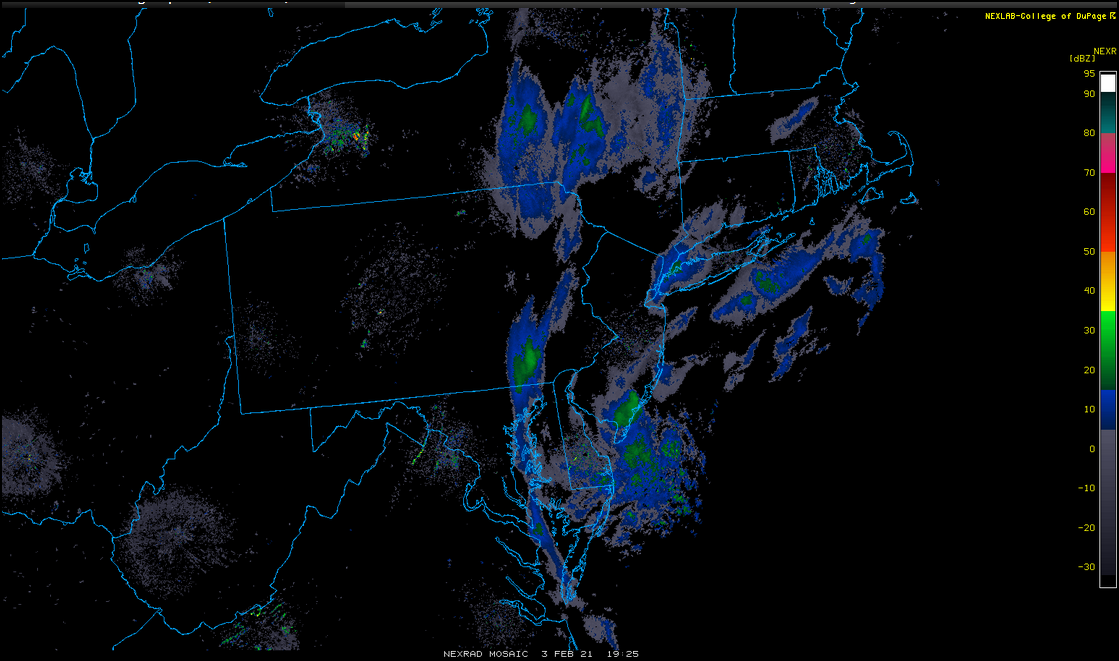
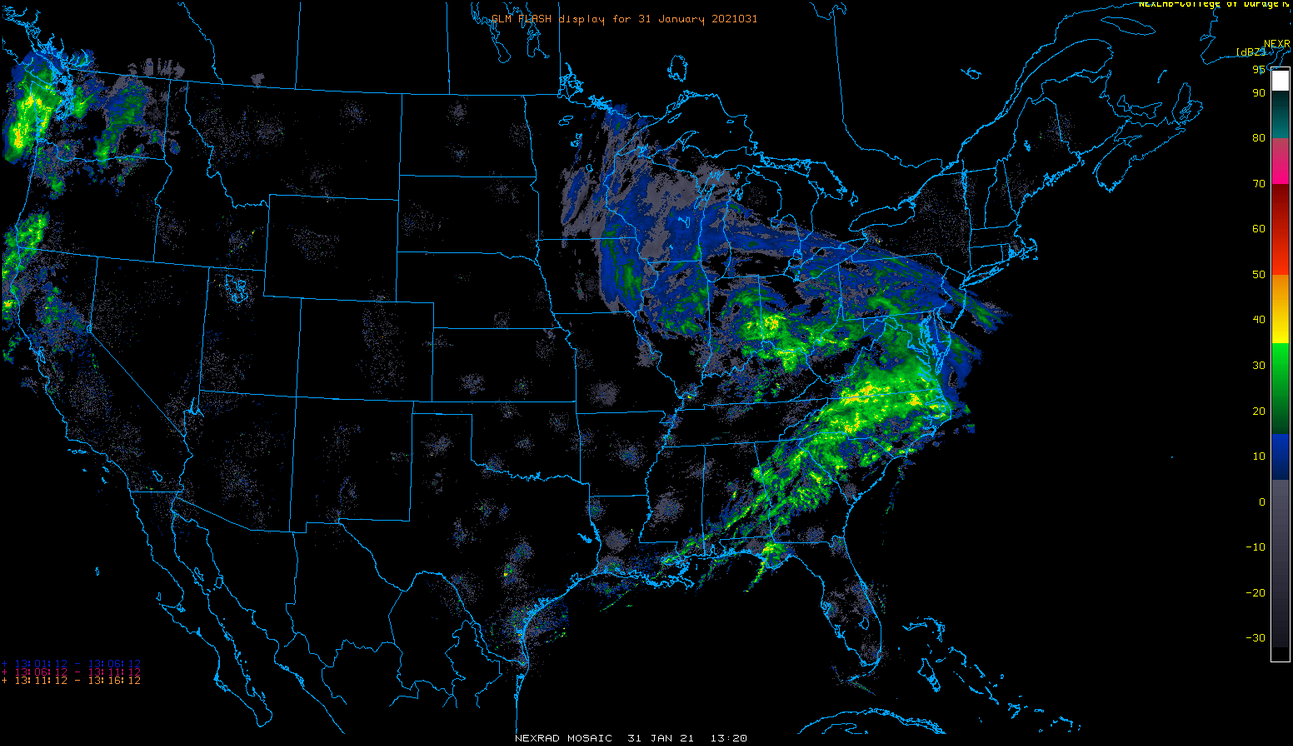
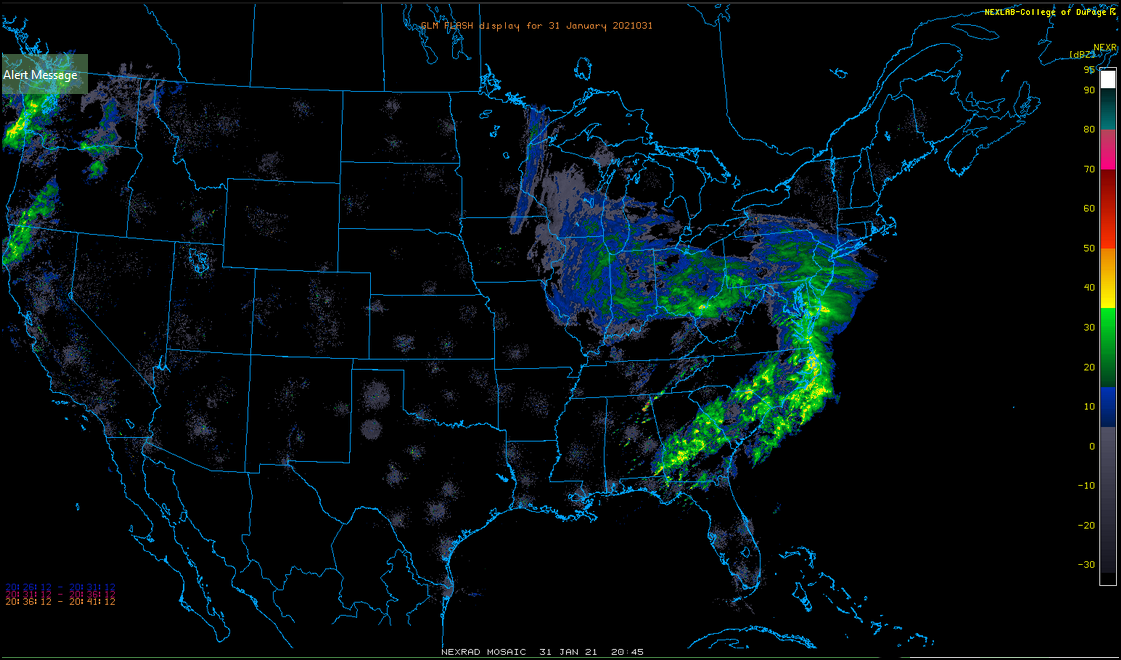
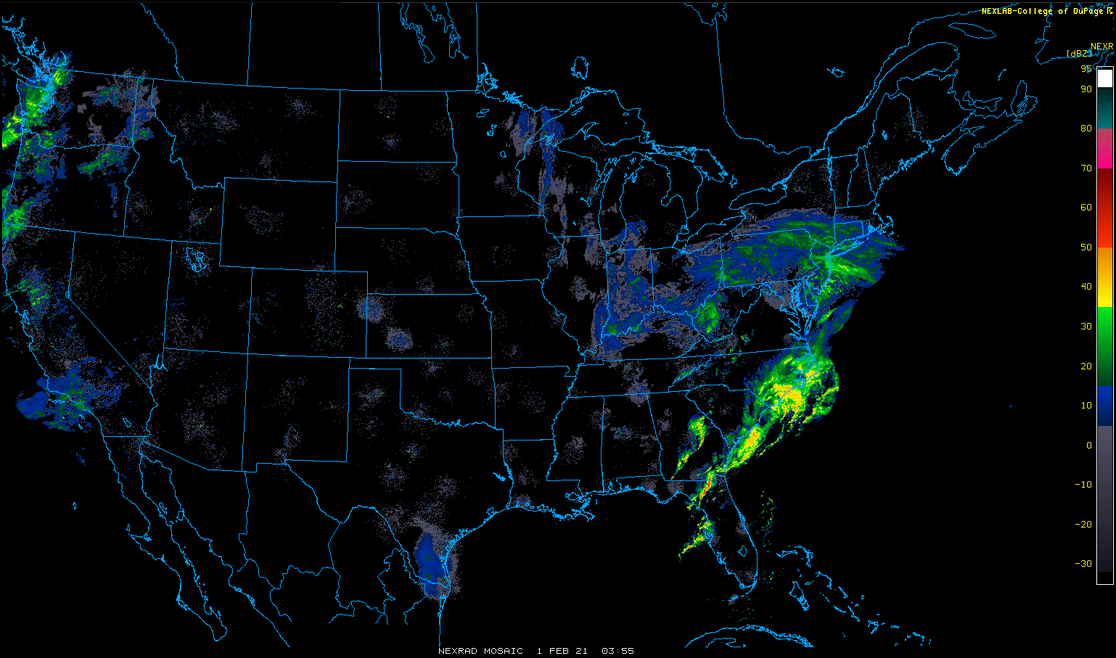
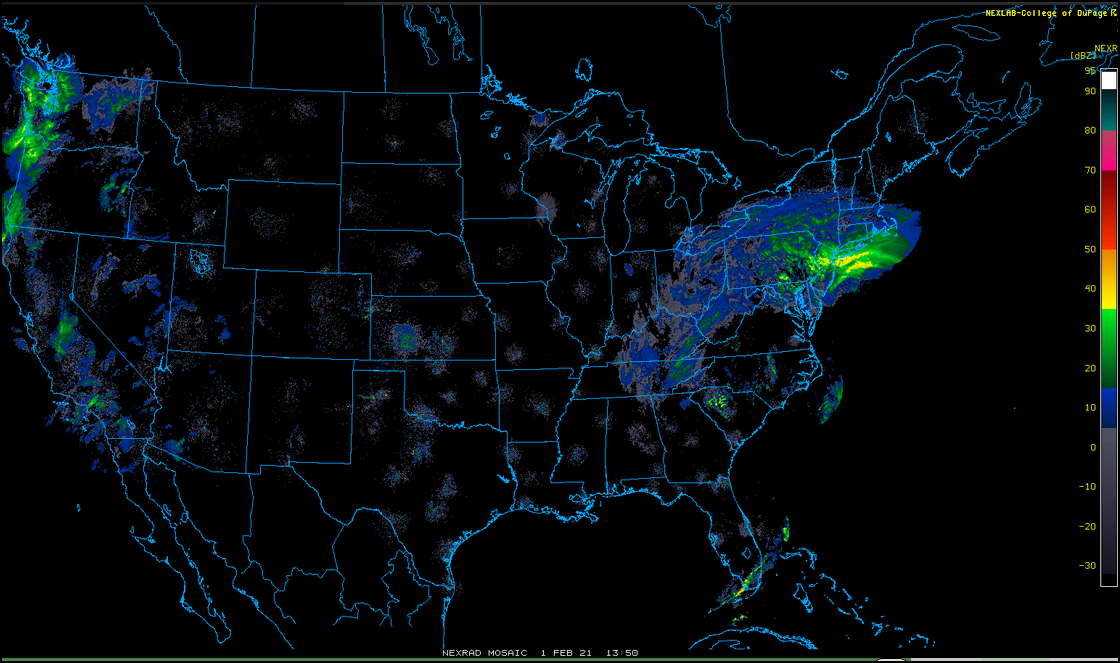
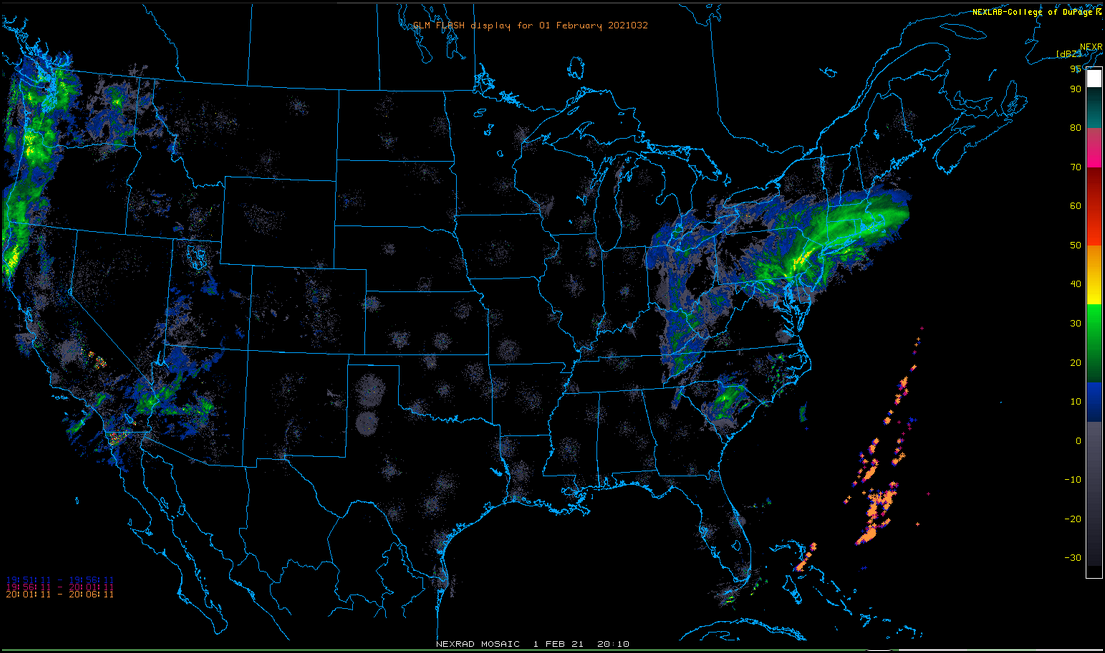
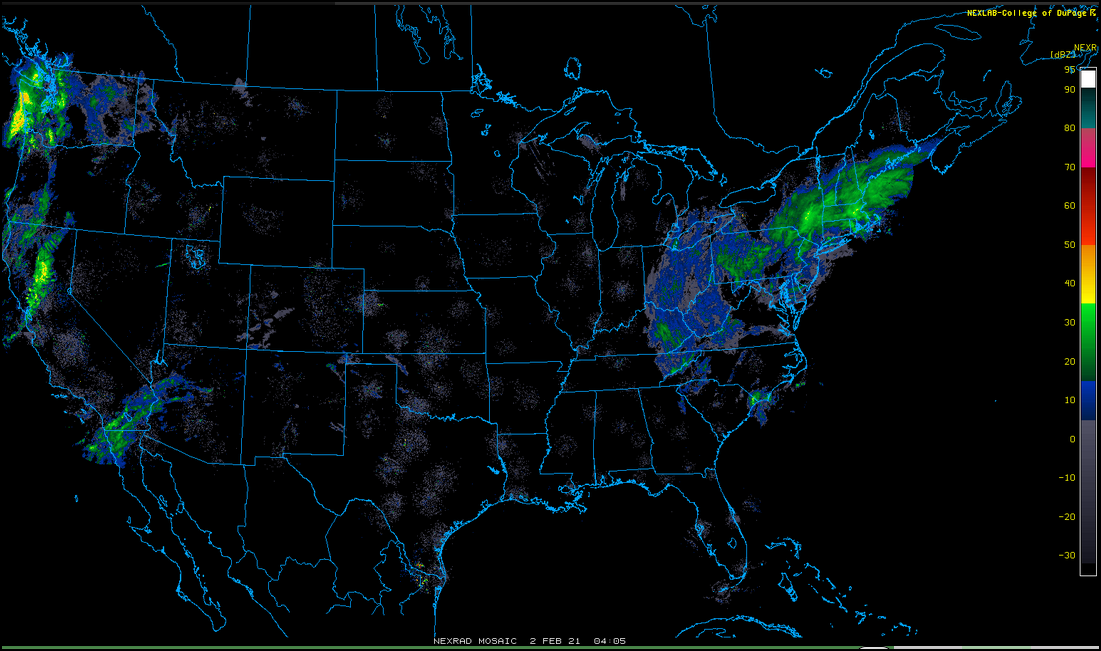
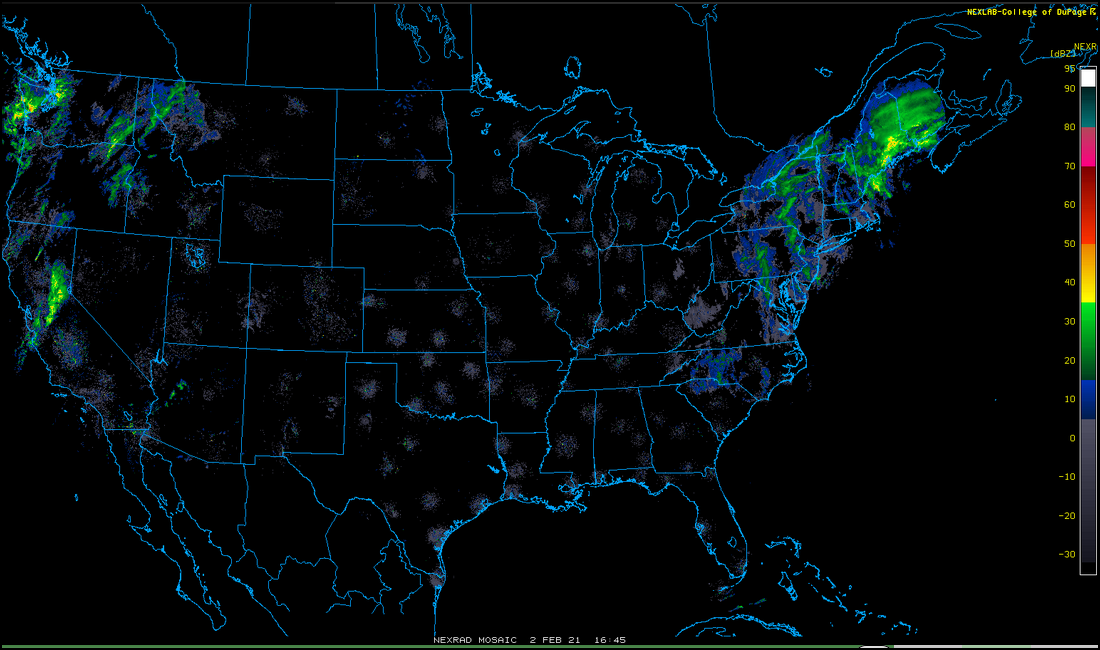
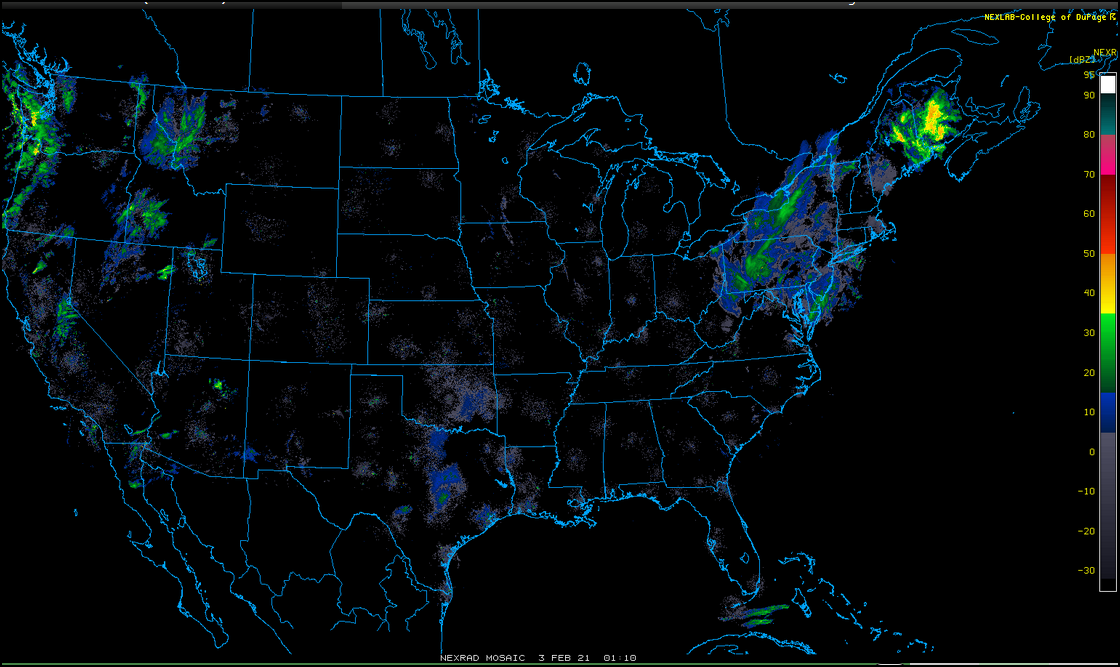
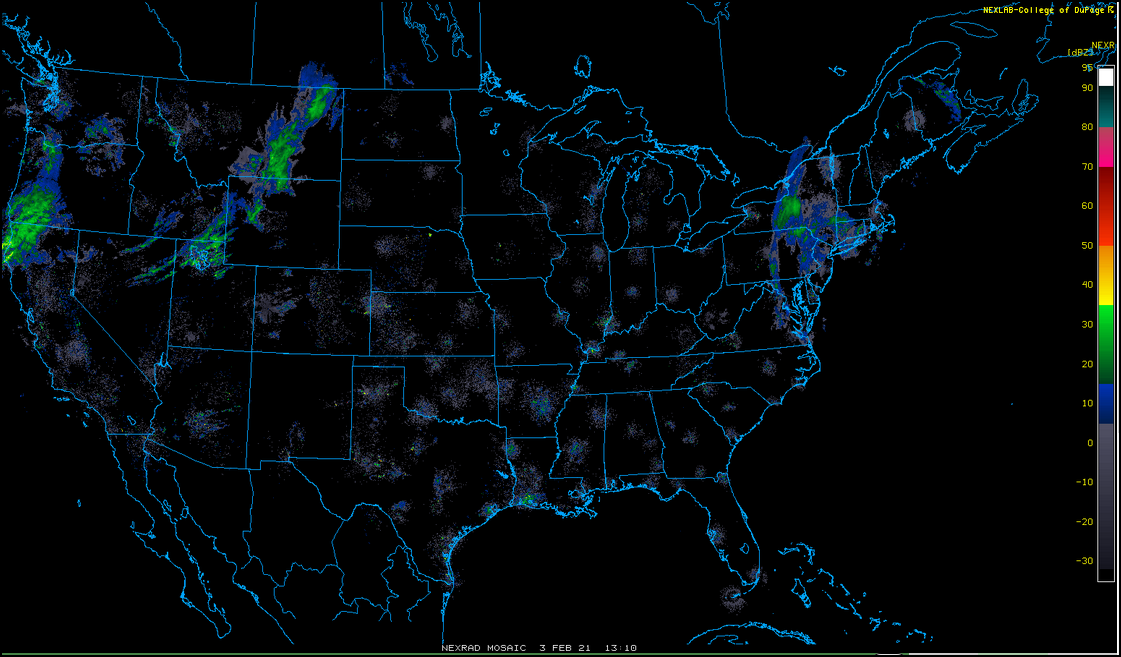
Radar imagery courtesy DOC / NOAA / NWS