Complete Results @ http://www.newx-forecasts.com/
Follow the left-side link from '21st Annual Snow Storm Contest > Verified Forecasts > ‘01-DEC-19’ to see the complete forecasters’ verification table by station
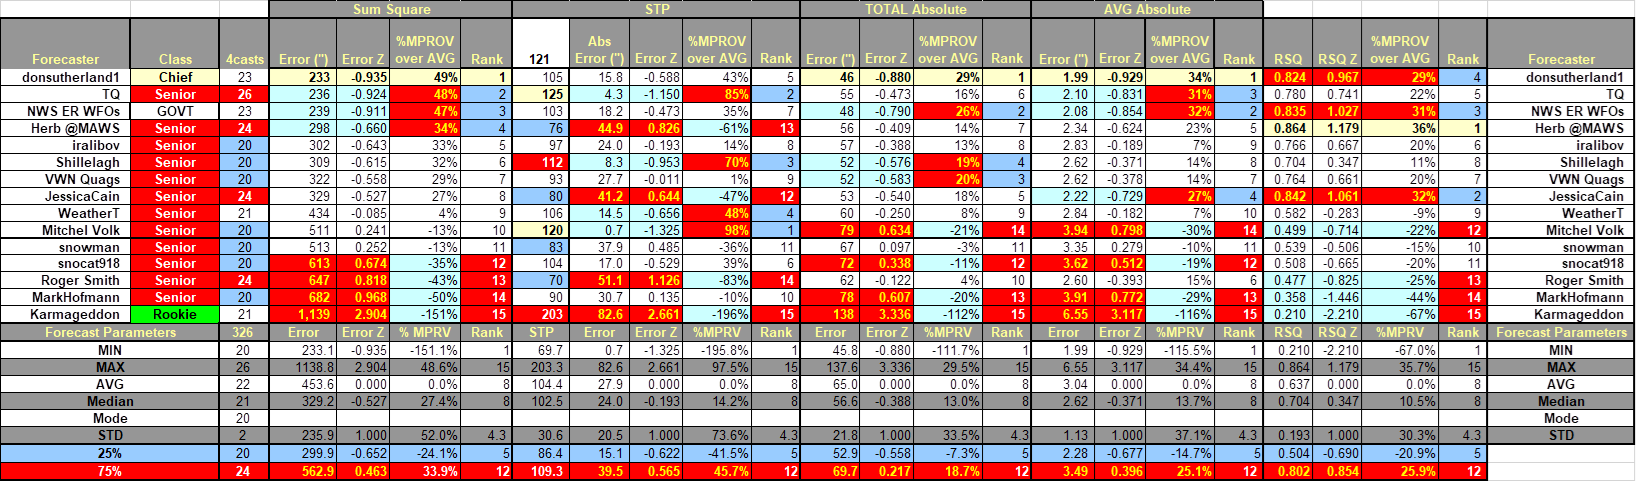
In the table ...
Yellow cells indicate the best score in category.
Forecast STP cells: yellow if within +/- 5% of observed STP.
Blue (Red) cells indicate the 25% (75%) percentile.
SUMSQ: sum of square errors (forecast accuracy measure accounting for magnitude and distribution of errors)
STP: storm total precipitation
TAE: total absolute error
AAE: average absolute error
Final Standings - all Forecasters
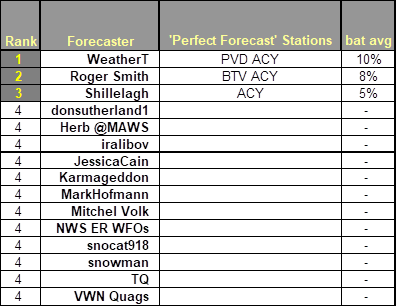
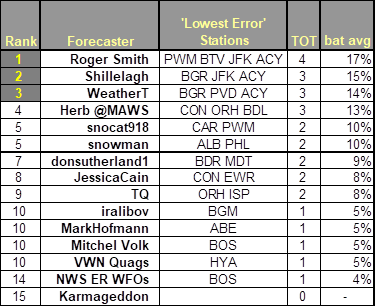
Station by Station Comparison of Best Forecasts
Perfect Forecasts (Batting Average - Percentage of Forecast Stations with No Error)
Best Station Forecasts (Batting Average - Percentage of Forecast Stations with Lowest Absolute Error)
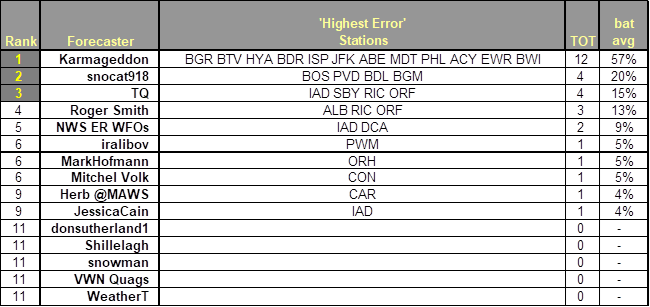
Best Station Forecast Busts (Batting Average - Percentage of Forecast Stations with Highest Absolute Error)
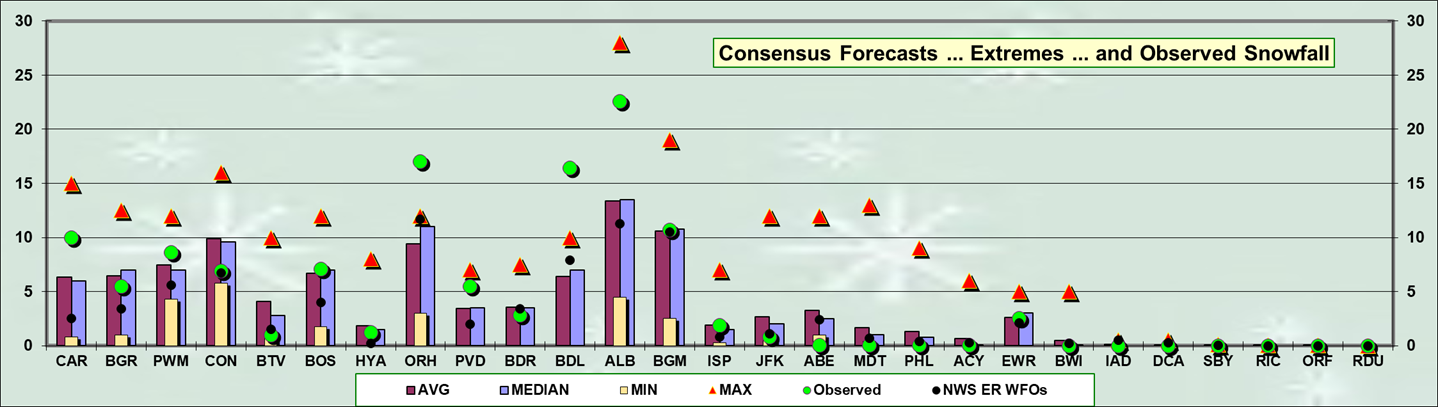
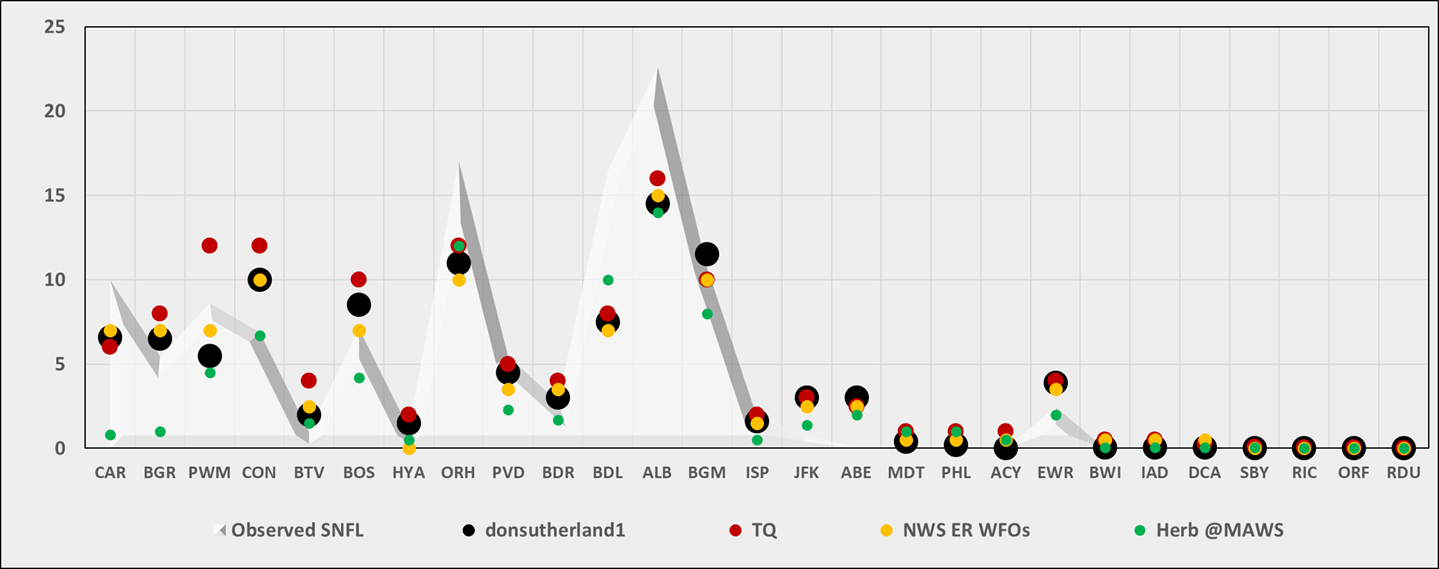
Consensus forecast best @ BGR … PWM … BOS …HYA … BDR … BGM … ISP … EWR
MAX forecast best @ ORH … PVD … ALB
MAX forecast less than observed
MIN forecasts best @ CON …BTV … JFK
MIN forecasts more than observed @ ABE
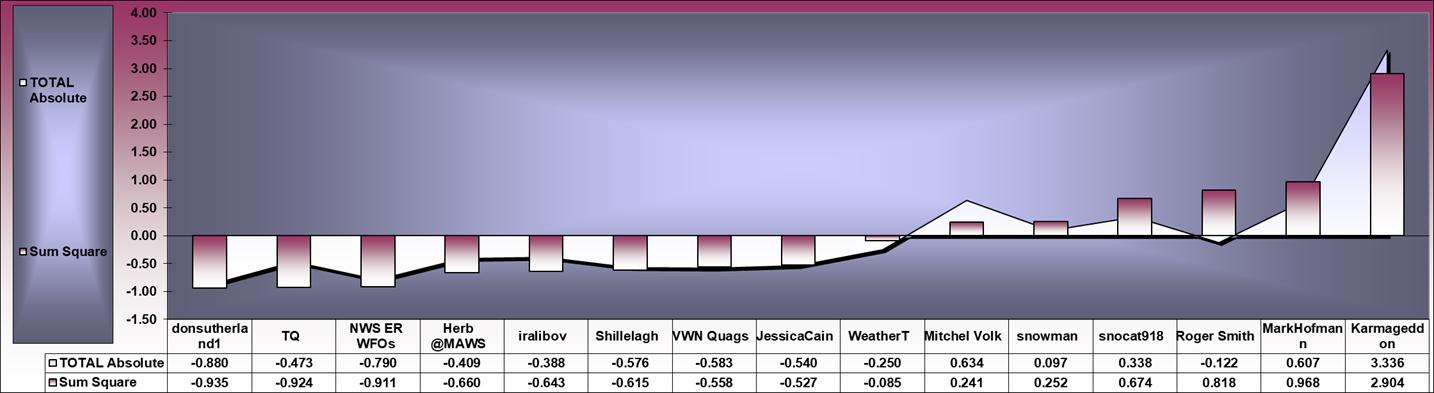
Strong correlation (R = 0.938) between SUMSQ and TAE Z-scores
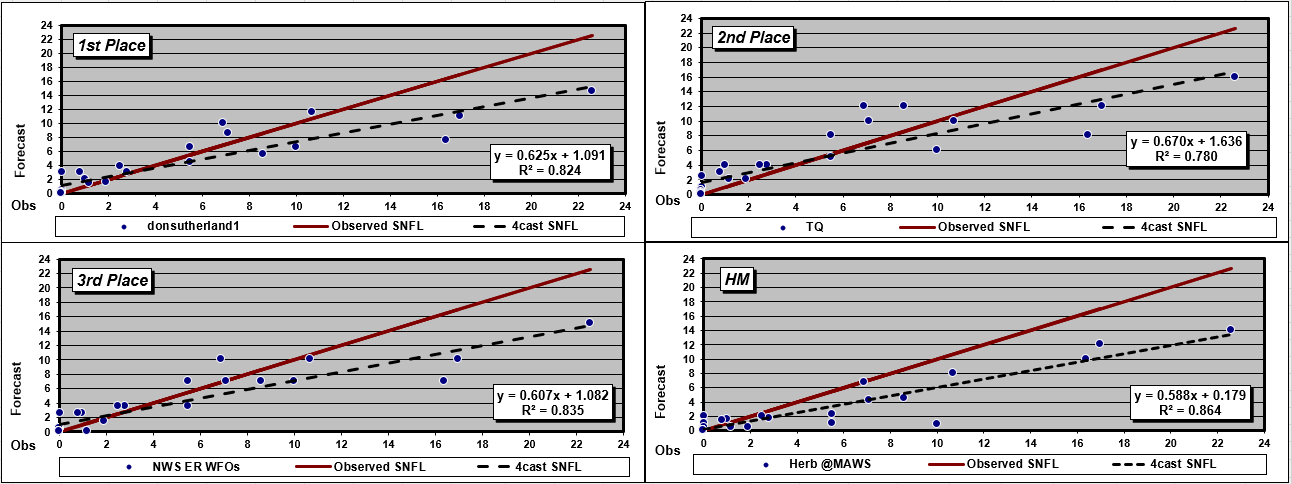
Dashed forecast trend line above (below) solid red Observed snowfall line ==> over (under) forecast
R2 value indicates how well the forecast captured the observed snowfall’s variability, i.e., R2 = 0.874 ==> the forecast captured ~87.4% of the observed snowfall’s variability.
*******************************
Storm-total snowfalls for SUN thru TUE from CDUS41 (CLI) ... CXUS51 (CF6) ... METARs ... and PNS bulletins.
Good coverage and reporting with an exception at CON.
Exceptions
CON
No daily snowfall reported in CF6 or CLI bulletins for 02-DEC-19.
PNSGYX carried 5.2" from ASOS
SUN-TUE CLI bulletins carried 3.5" ... MM ... 1.9" = 5.4" (0.69" liquid)
CON METARs did not report mixed-precipitation
PWM SLR 10:1 (no mixed precipitation)
ORH SLR 10.7 (0.02" freezing precipitation removed)
CON verification STP: 6.9" (estimated at 10:1 SLR for 0.69 liquid precipitation – value in line with PNS vicinity reports using inverse distance weighting technique)
STP may be amended if official data reported prior to posting of FINAL results.
HYA
STP estimated by applying 10:1 SLR to 0.12" liquid reported in METARs during period of frozen precipitation at the station.
---
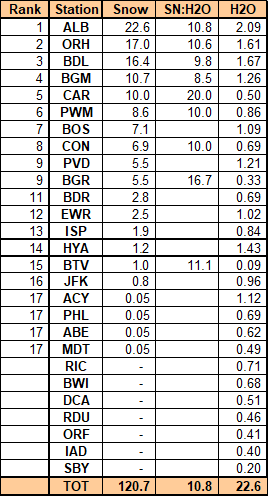
Average forecast area snow-to-liquid ratio (SN:H20) is quantity-weighted.
SLR not reported for some stations with measurable snowfall b/c significant liquid and / or freezing precipitation also occurred during the verification period.
---
Stations observing >= Trace: 20 (74%)
Given stations with measurable snowfall ... stations observing at least:
4" - 10 (63%)
8" - 6 (38%)
12" - 3 (19%)
18" - 1 (6%)
Max snow melt-water (minimum SLR 10:1)
ALB: 2.09"
BDL: 1.67"
ORH: 1.61"
Max precipitation (frozen + freezing + liquid):
ALB: 2.09"
BDL: 1.67"
ORH: 1.61"
---
New daily record(s)
ALB - 13.3" (3.7"; 1969)
ORH - 8.9" (4.2"; 1917)
BDL - 4.6" (1.9"; 1925)
BOS - 1.6" (1"; 1940)
PVD - 1.6" (0.5"; 1907)
BDR - 0.7" (T"; 2012)
02-DEC-19
BGM - 9.6" (4.6"; 2005)
BDL - 8.8" (6"; 1949)
ALB - 6.8" (6.2"; 1949)
03-DEC-19
BOS - 4.8" (4"; 1893)
PVD - 3.4" (3.3"; 1963)
JFK - 0.2" (T"; 1989)
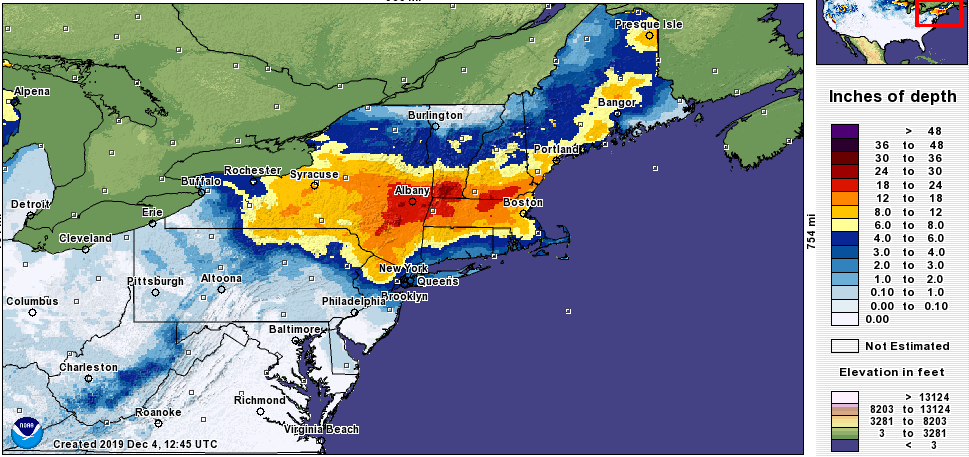
Approximate storm-total snowfall courtesy NOHRSC
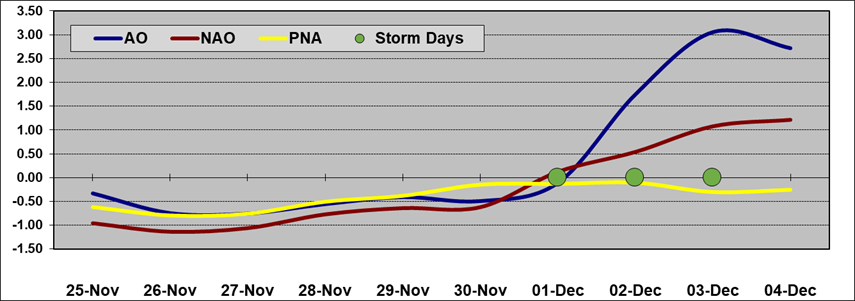
Teleconnection time-series data courtesy CPC
Surface analysis courtesy DOC / NOAA / NWS / NCEP / WPC
Upper air charts courtesy University of WY
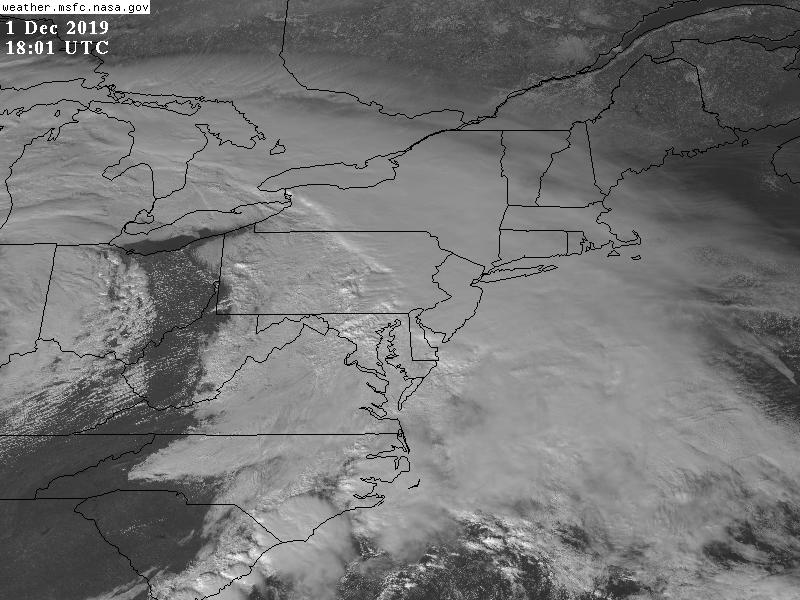
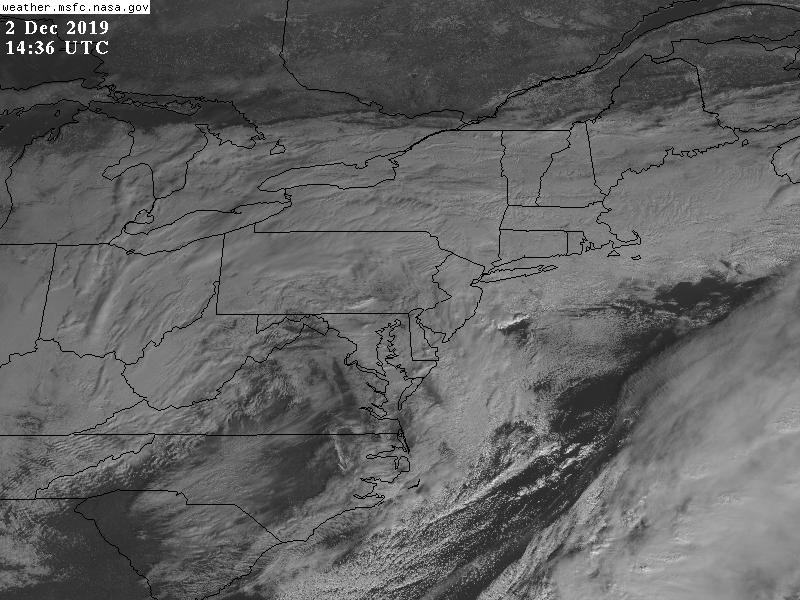
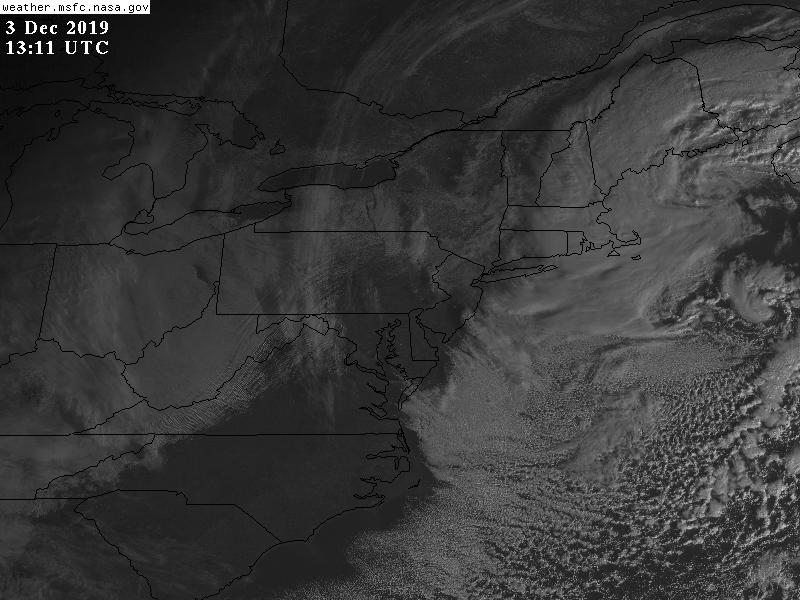
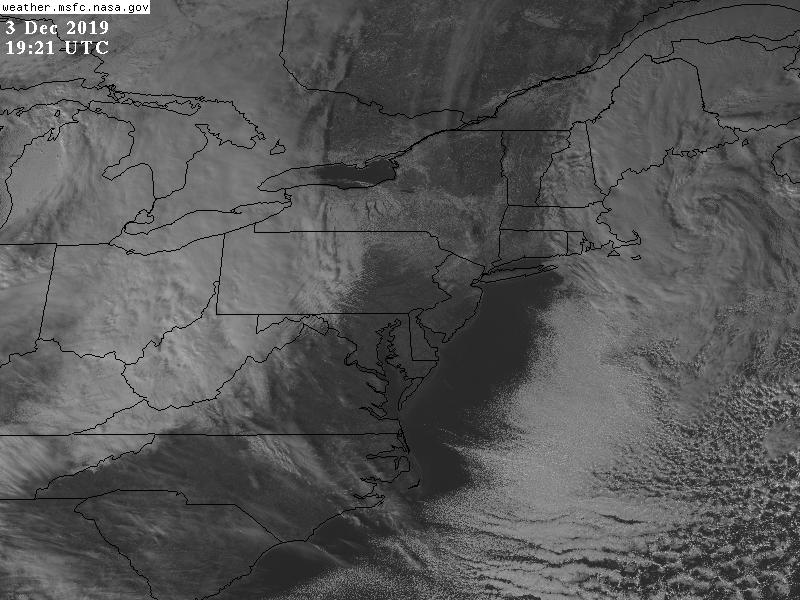
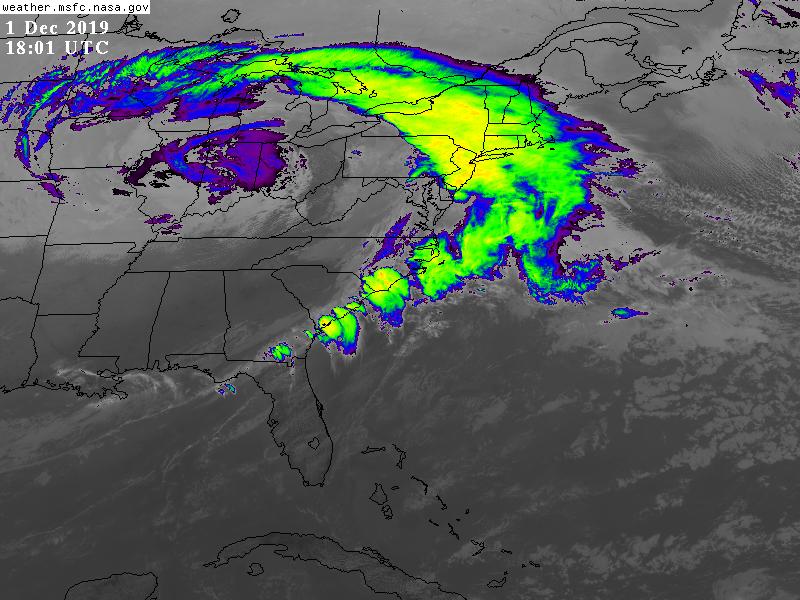
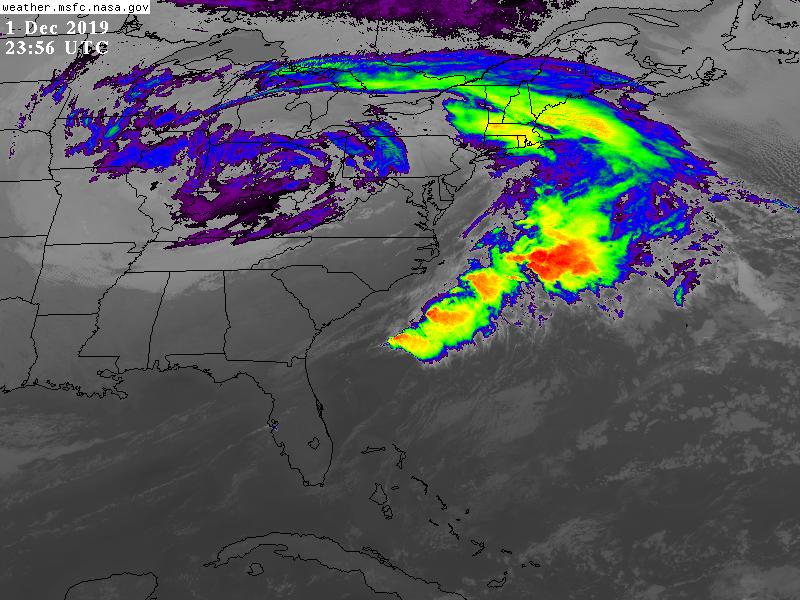
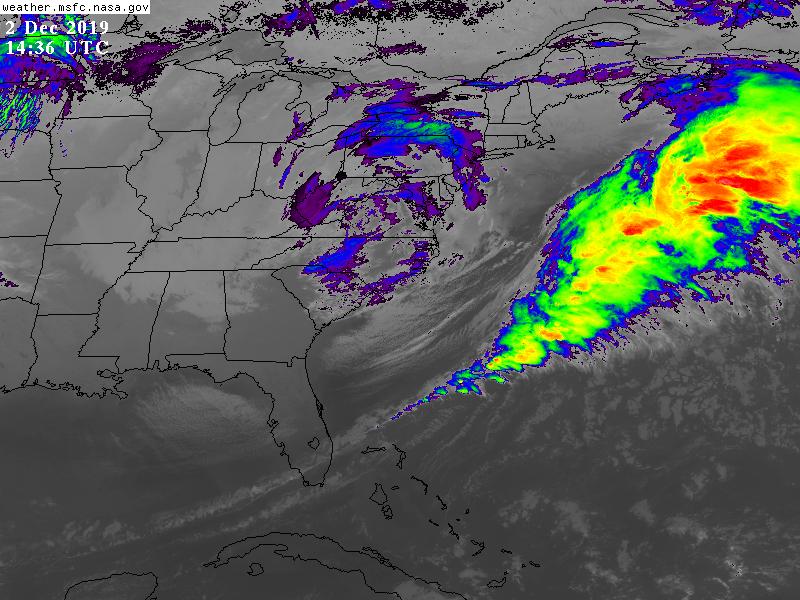
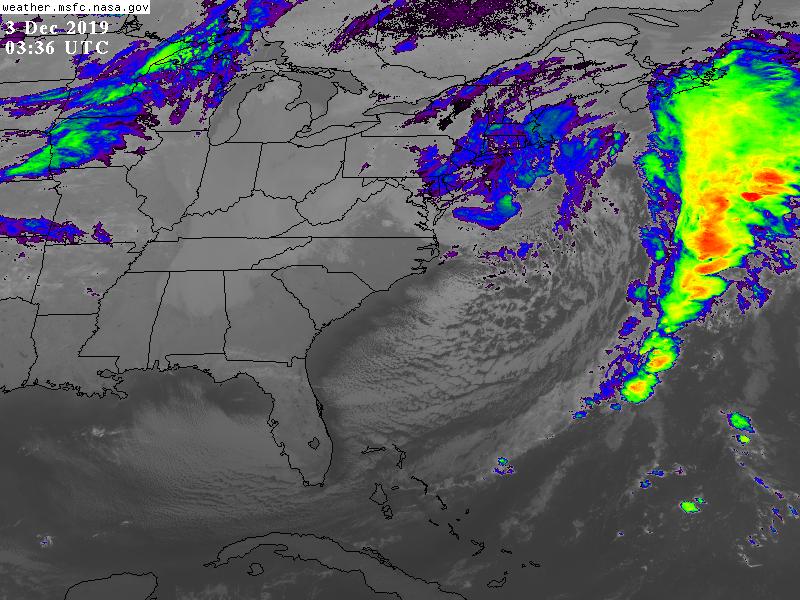
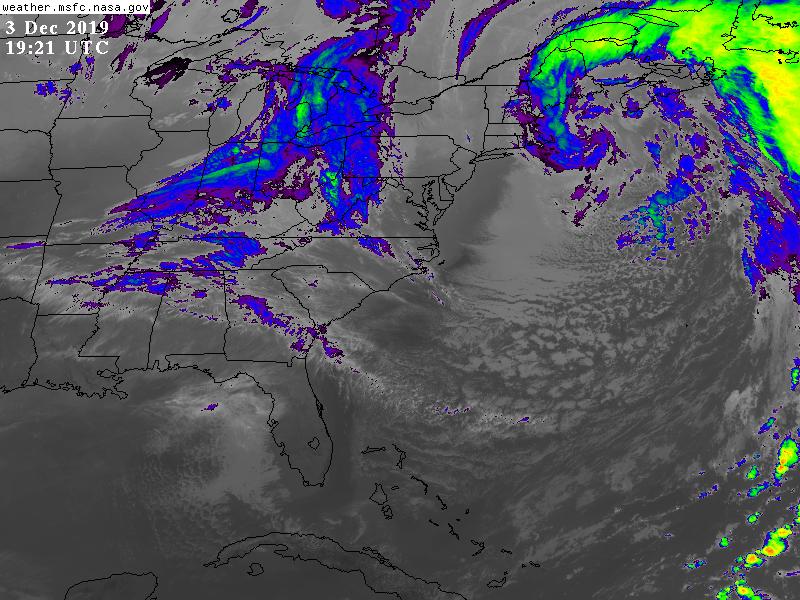
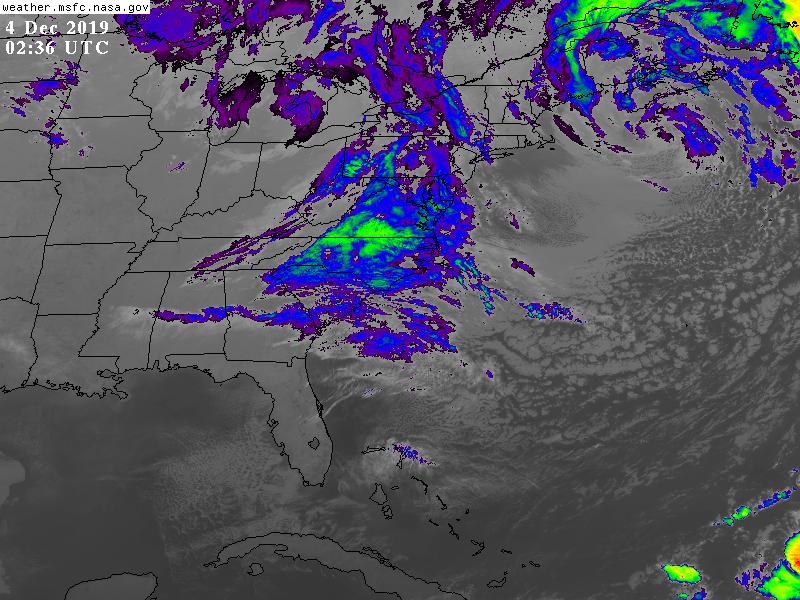
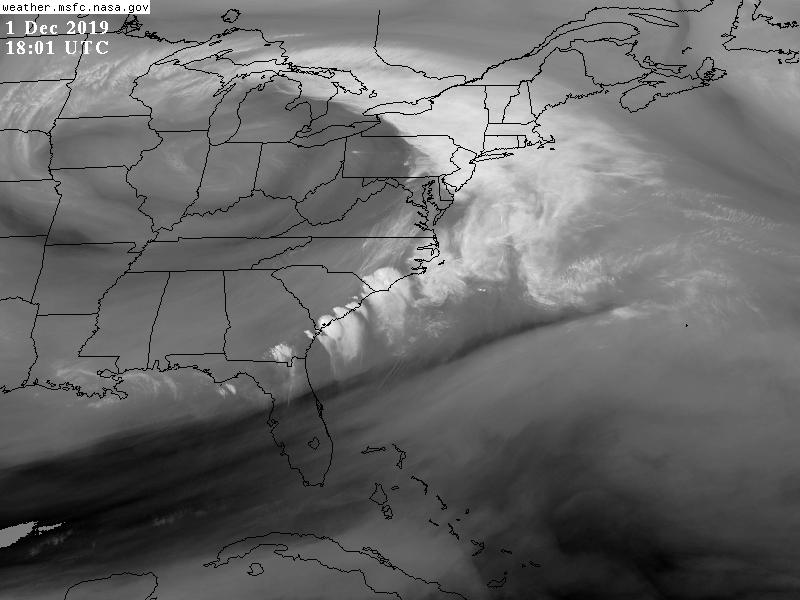
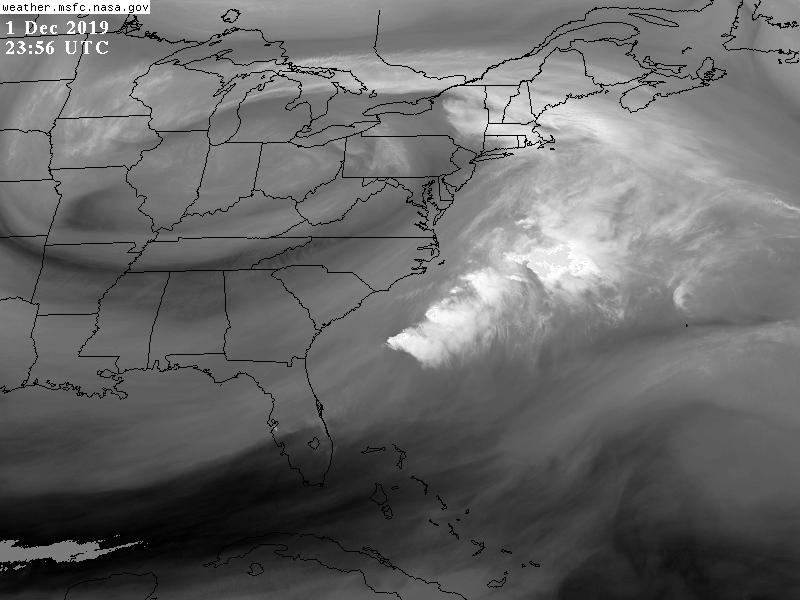
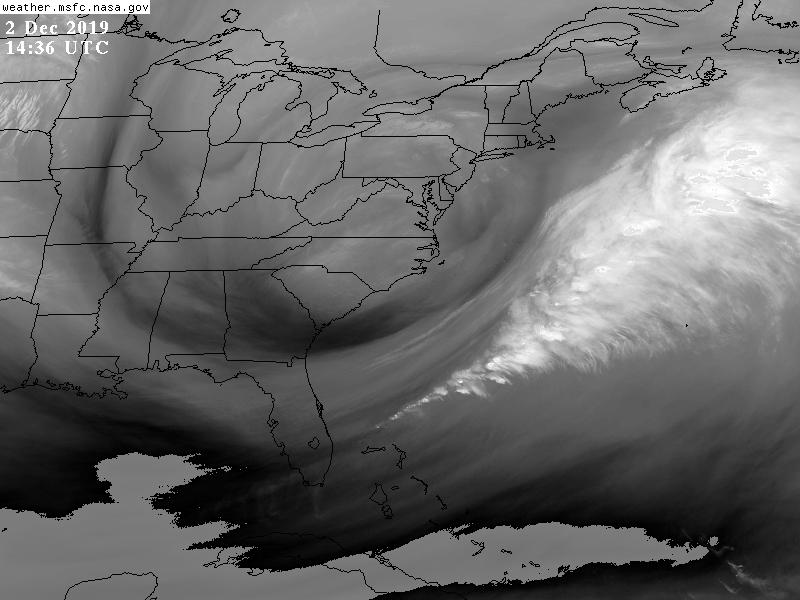
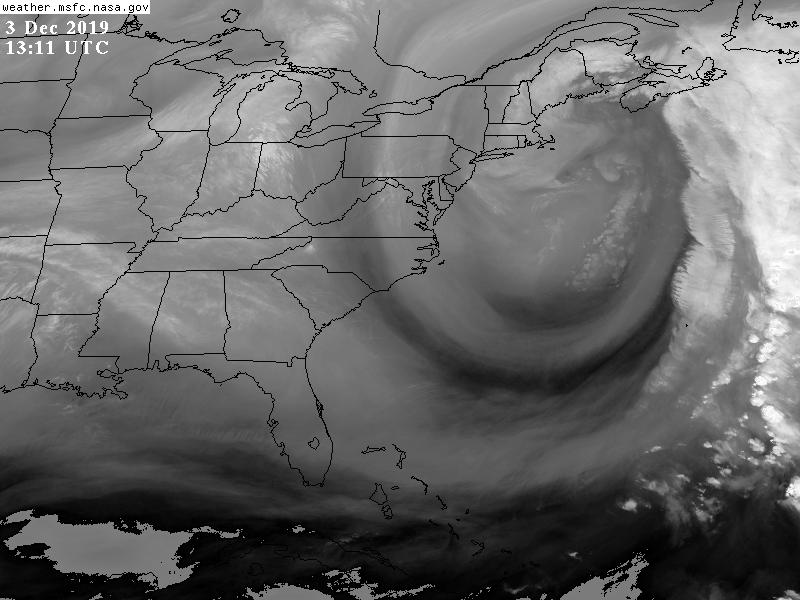
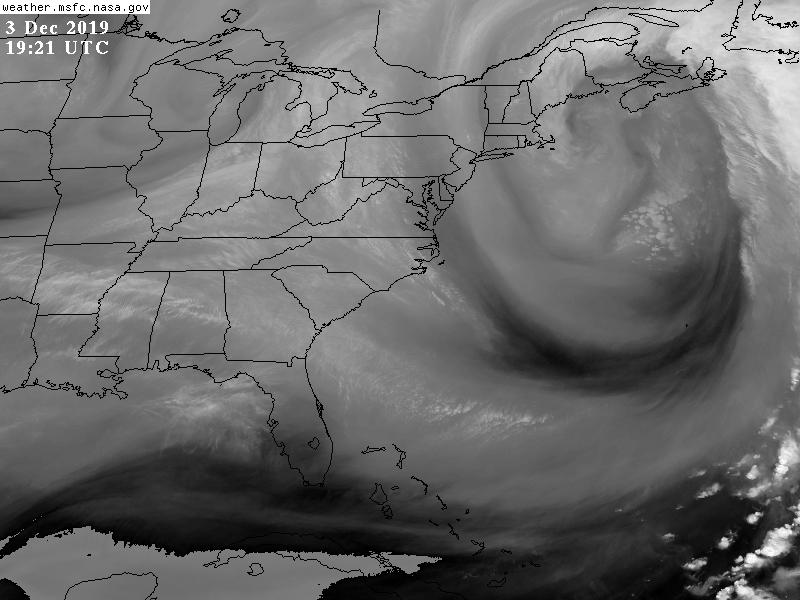
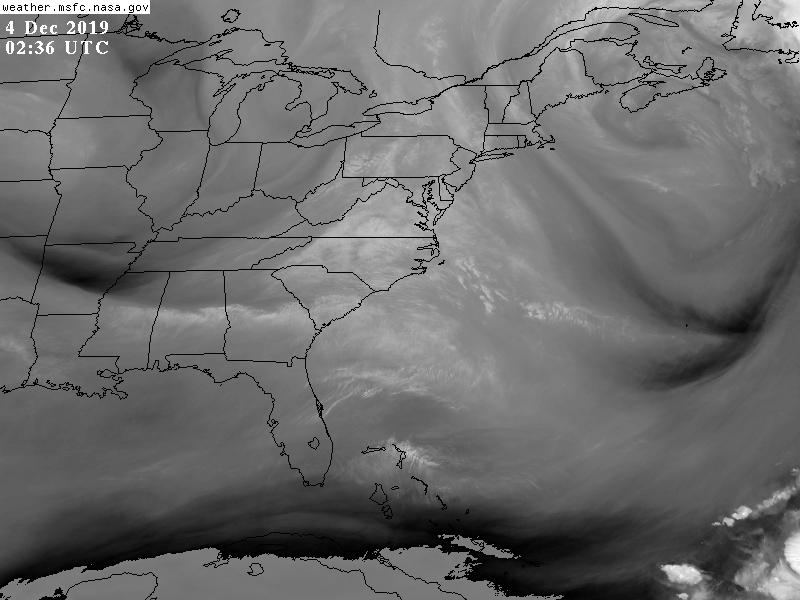
Imagery courtesy George C. Marshall Space Flight Center Earth Science Branch
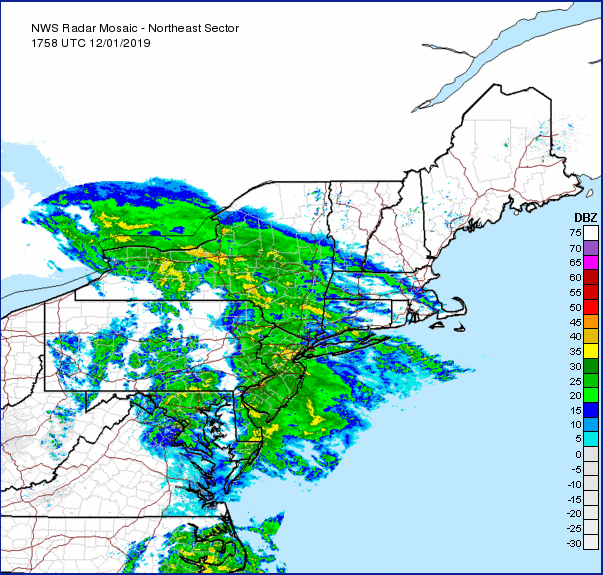
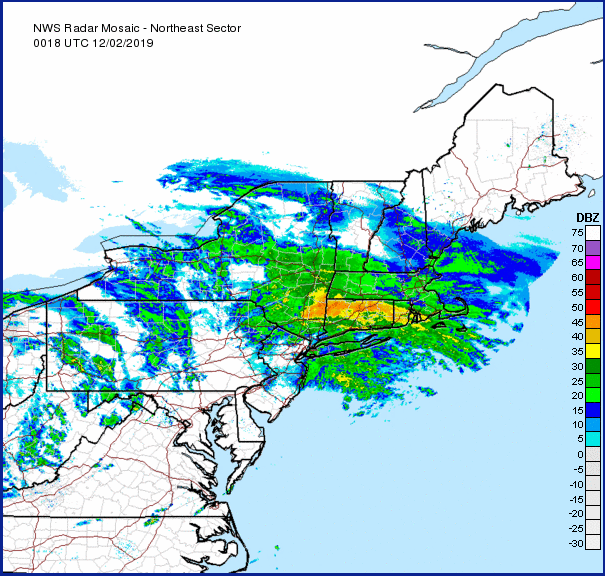
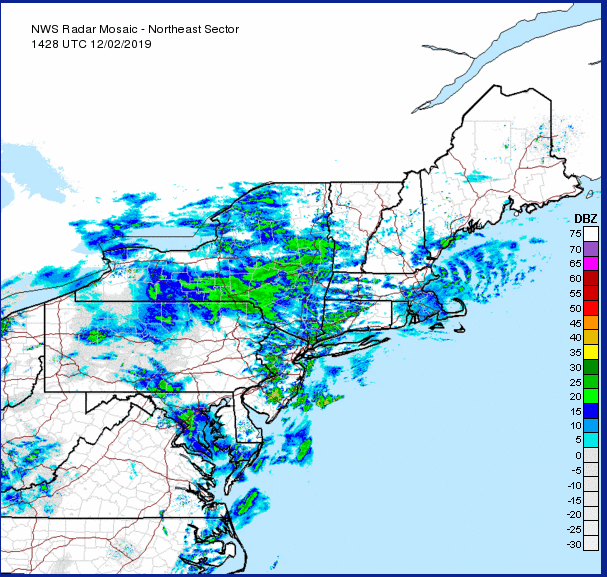
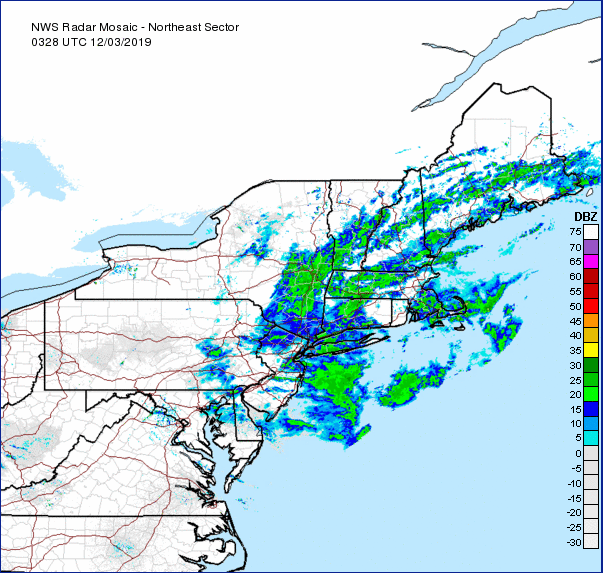
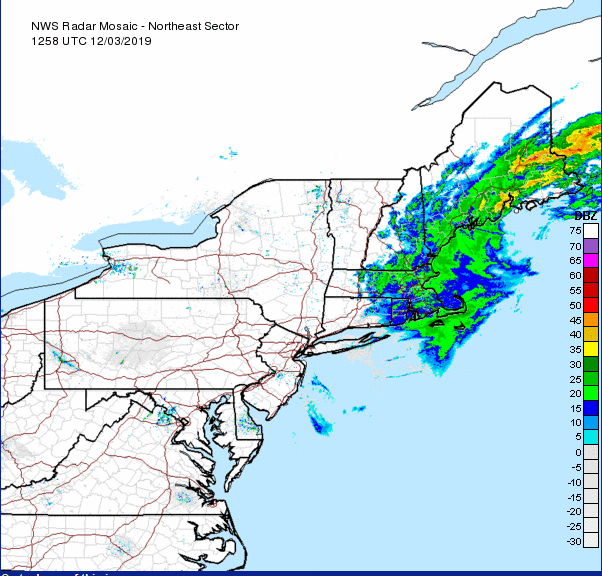
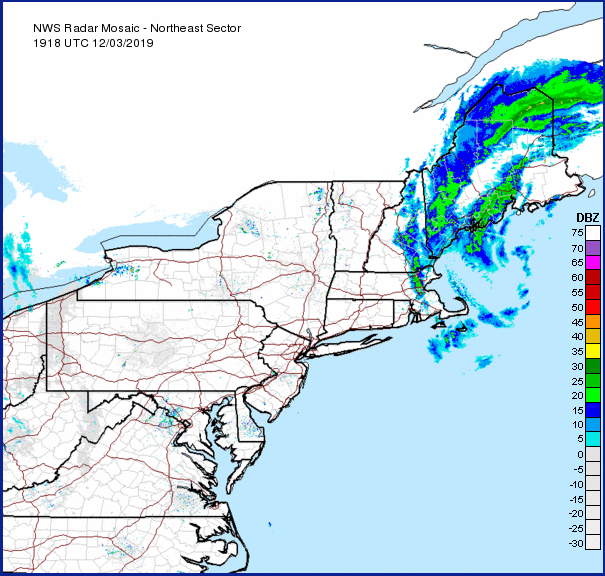
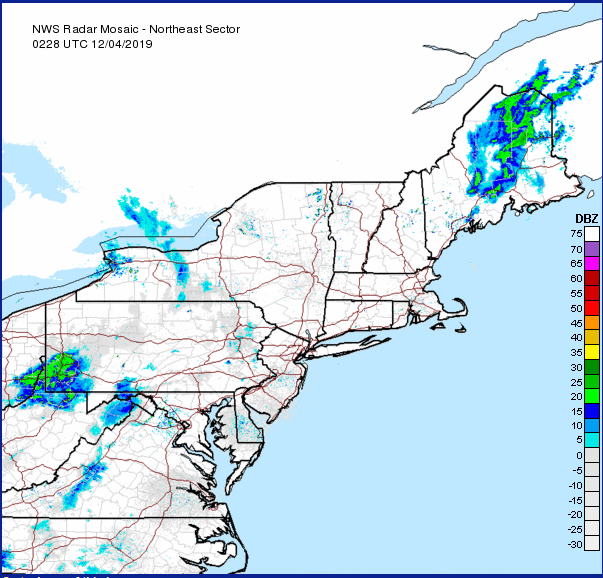
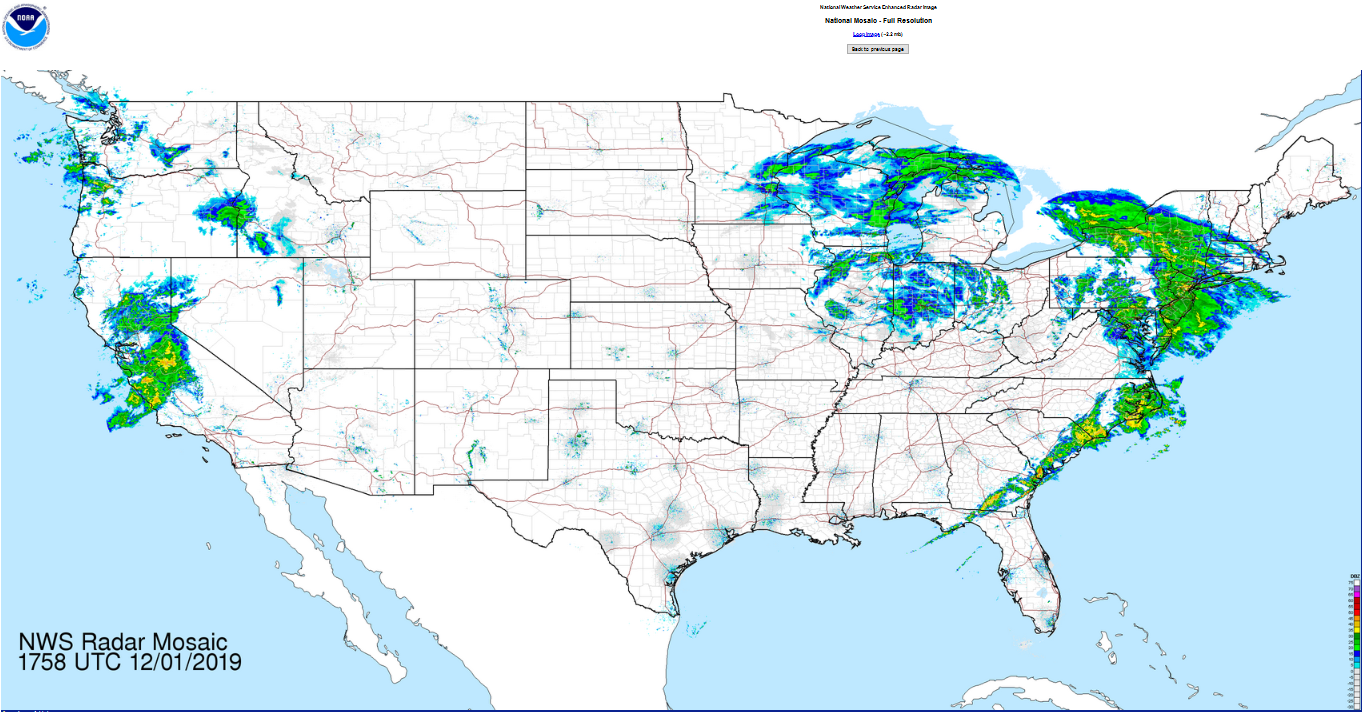
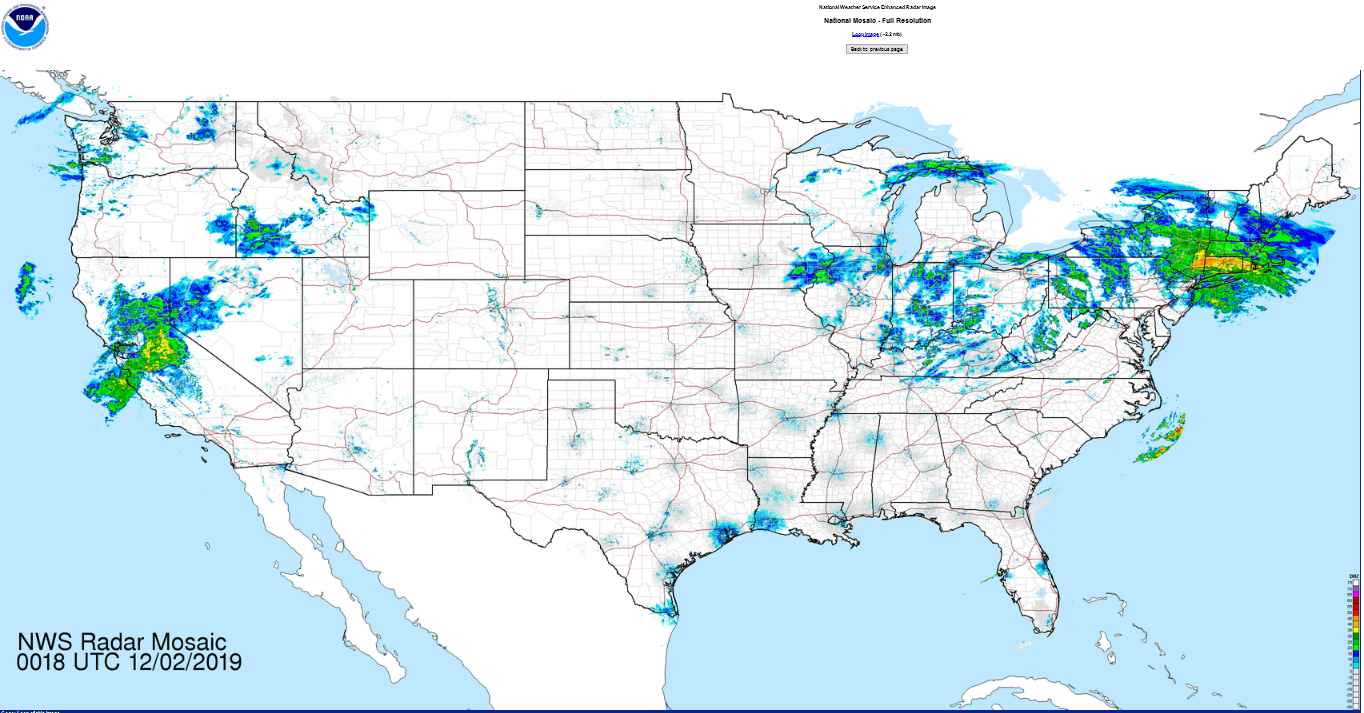
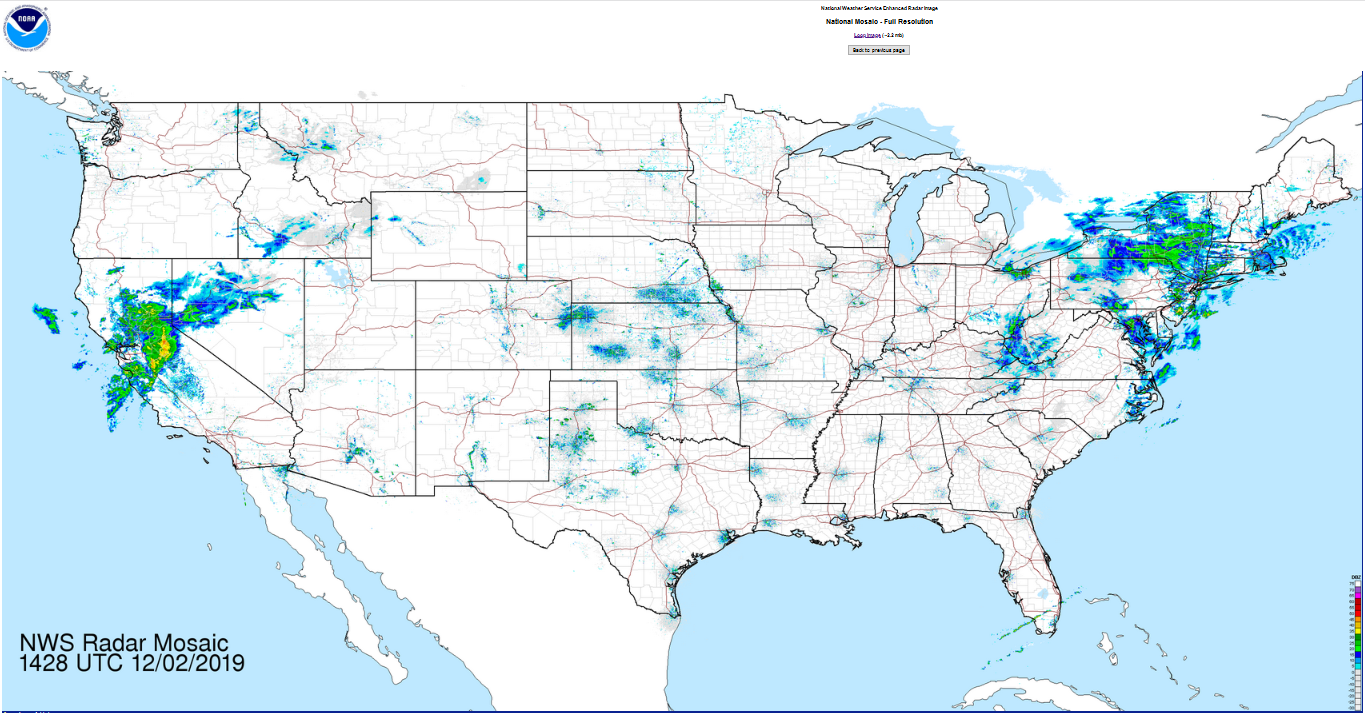
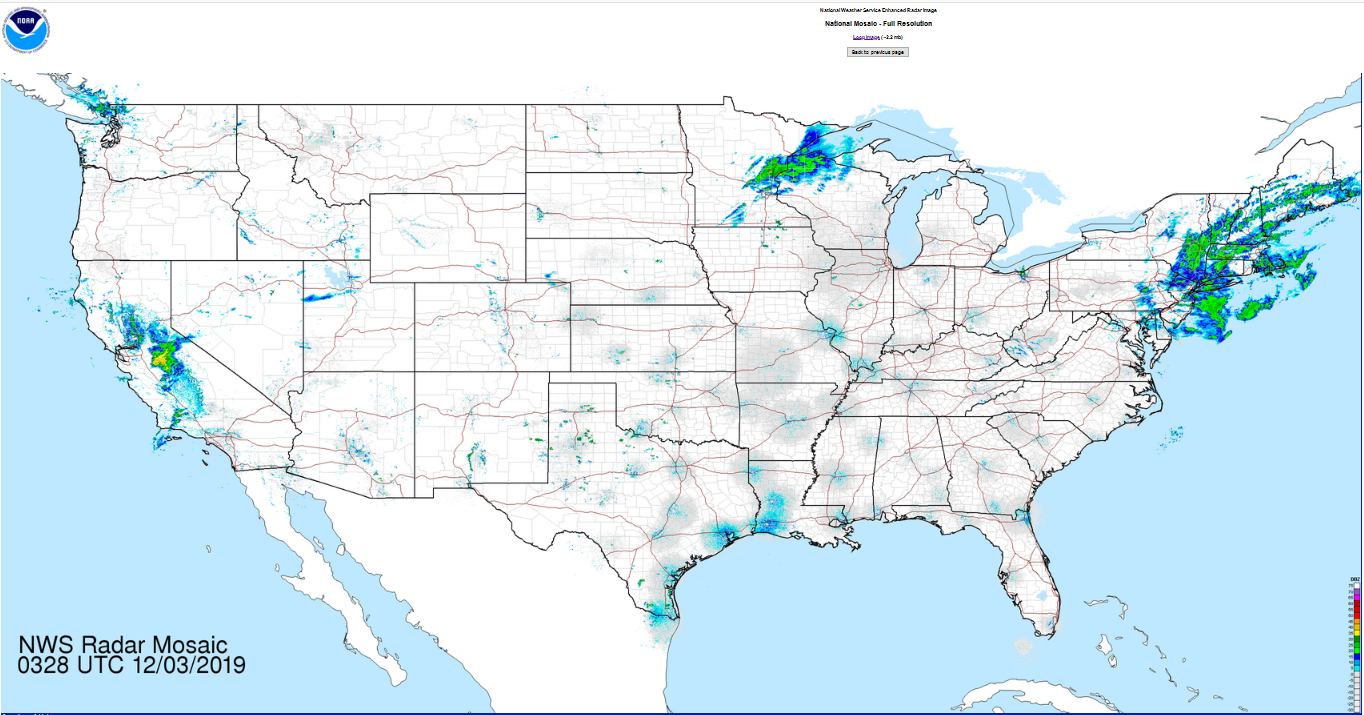
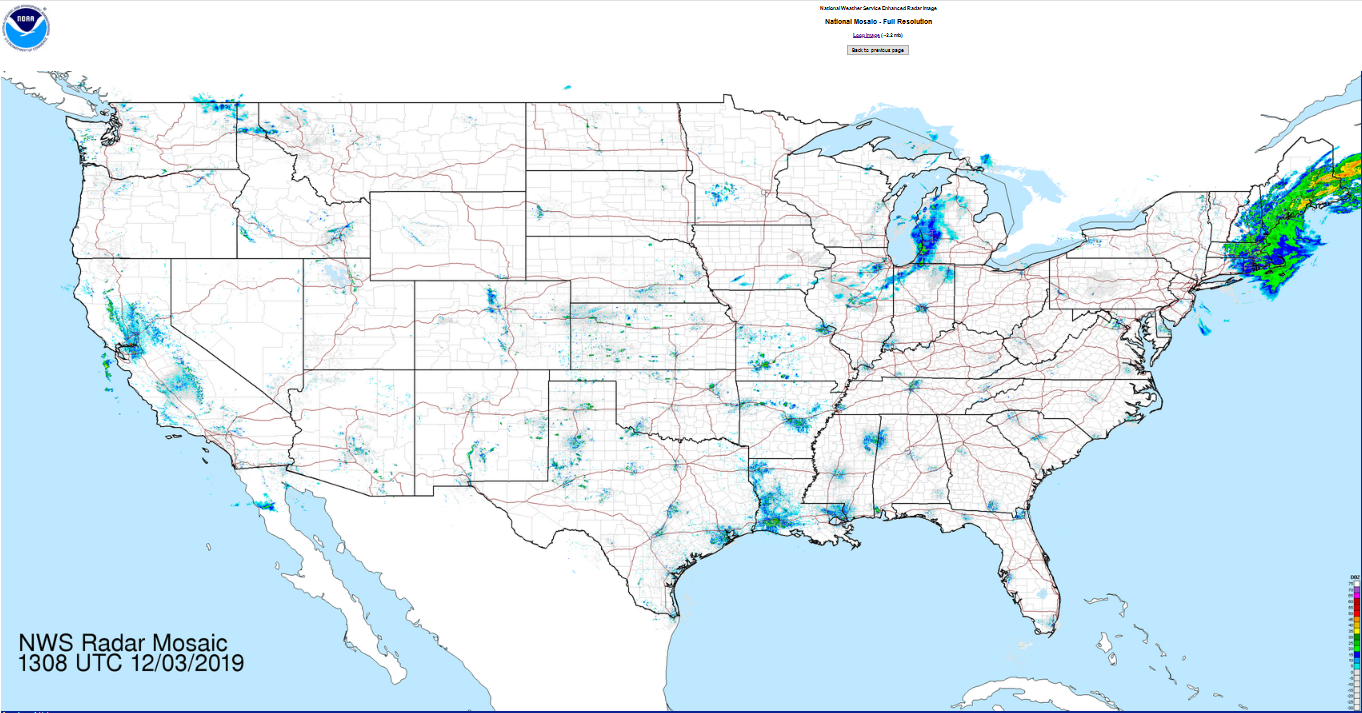
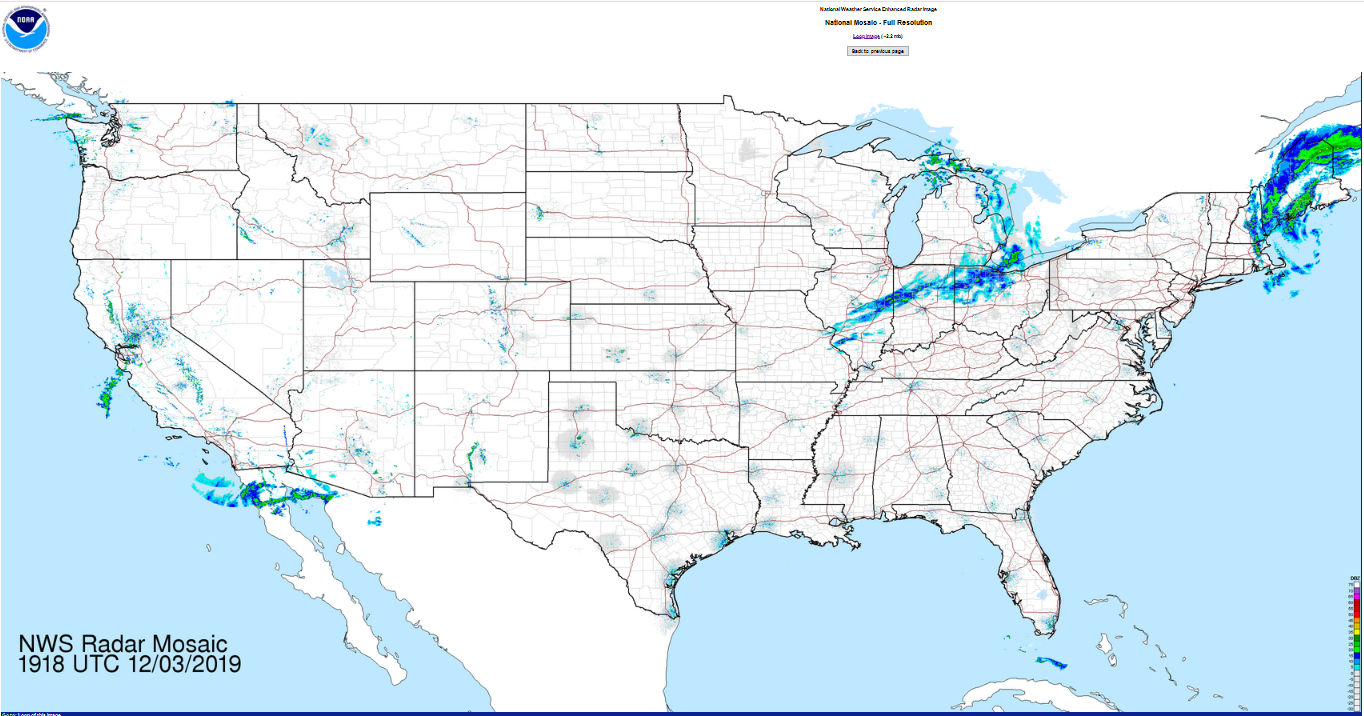
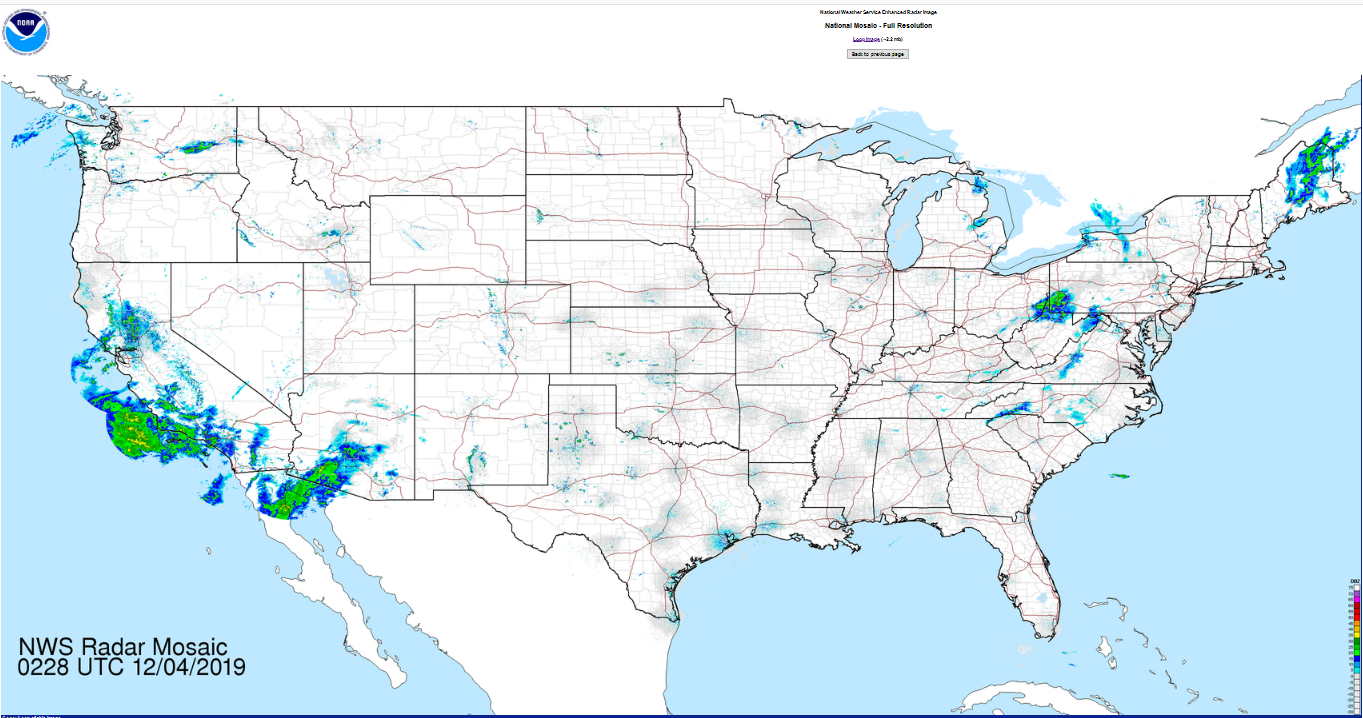
Radar imagery courtesy DOC / NOAA / NWS