Complete Results @ http://www.newx-forecasts.com/
Follow the left-side link from '20th Annual Snow Storm Contest > Verified Forecasts > ‘12-FEB-19’ to see the complete forecasters’ verification table by station
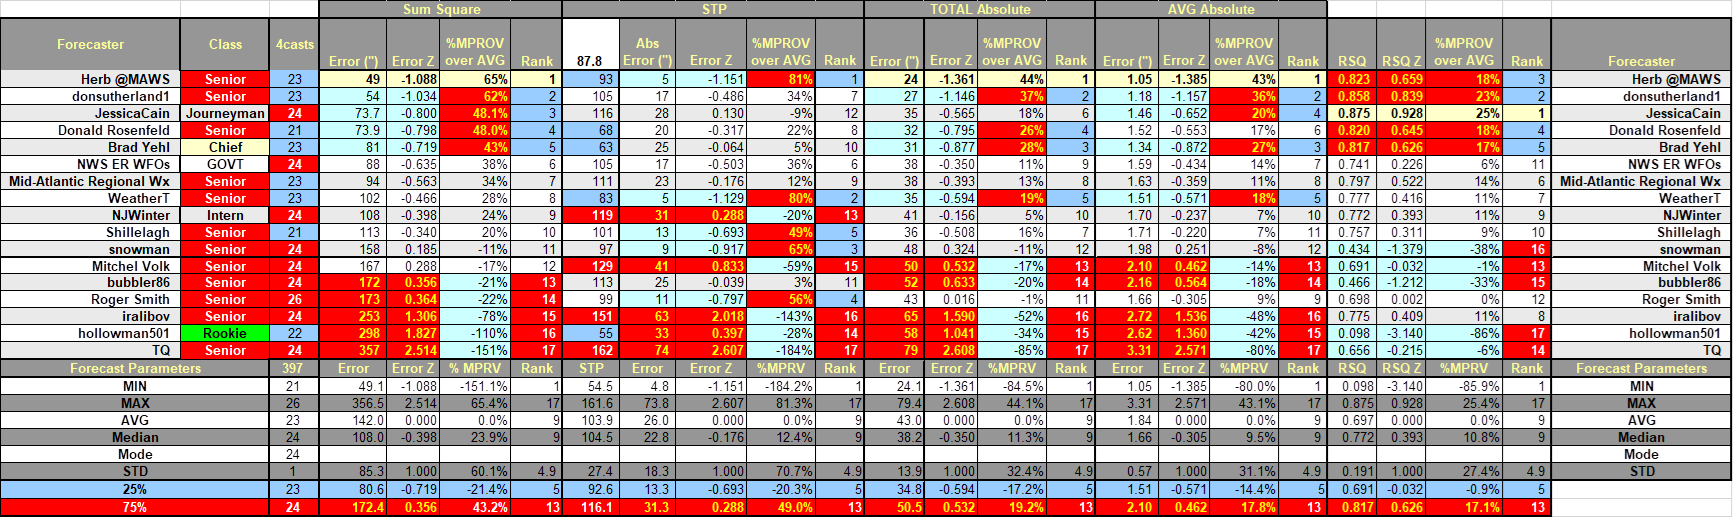
In the table ...
Yellow cells indicate the best score in category.
Forecast STP cells are yellow if within +/- 5% of observed STP.
Blue (Red) cells indicate the 25% (75%) percentile.
SUMSQ: sum of square errors (forecast accuracy measure accounting for magnitude and distribution of errors)
STP: storm total precipitation
TAE: total absolute error
AAE: average absolute error
Final Standings - all Forecasters
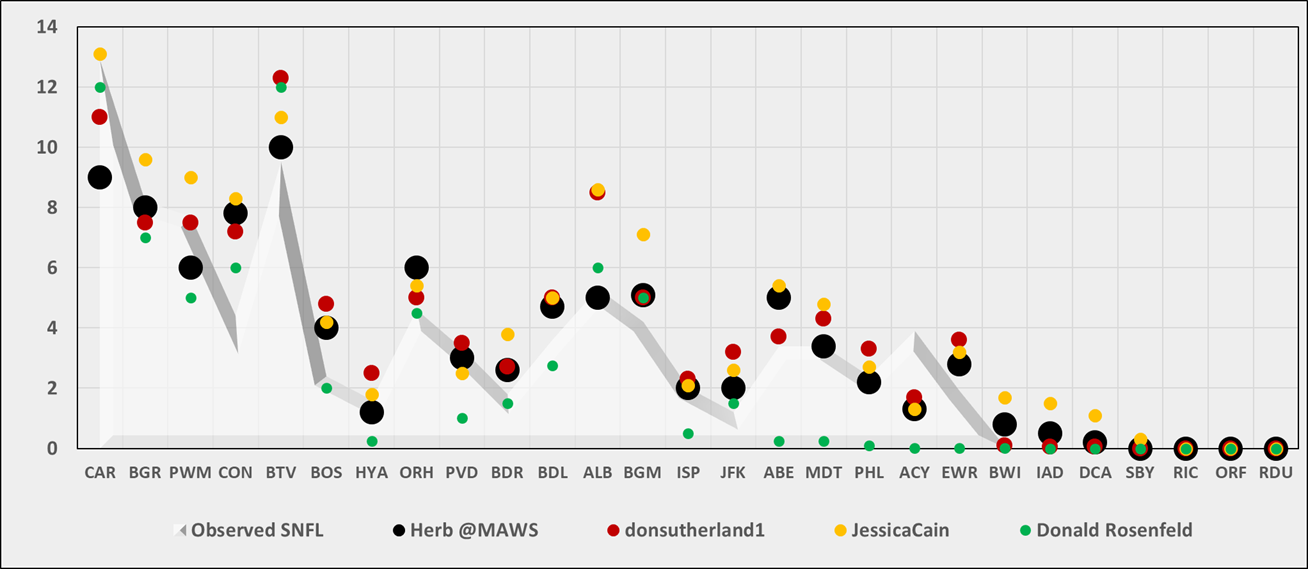
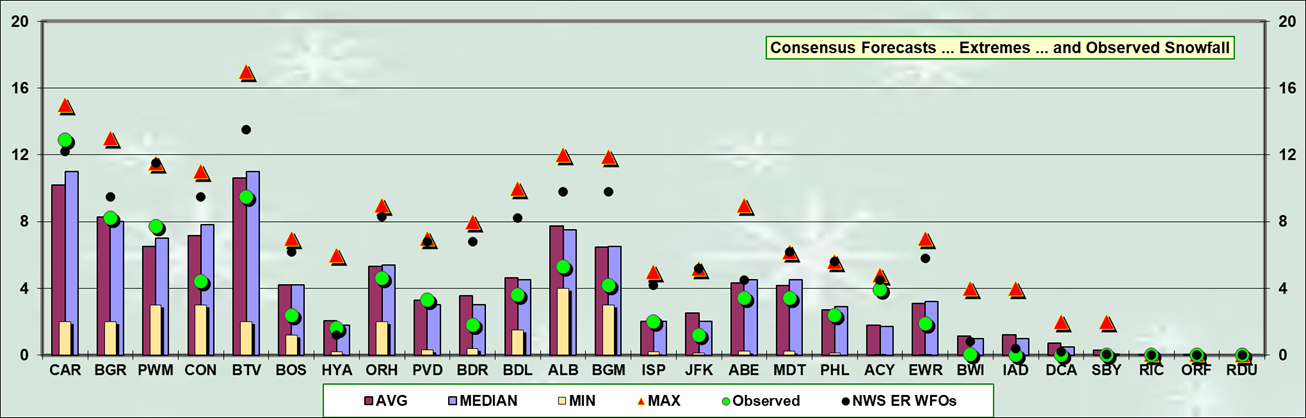
Station by Station Comparison of Best Forecasts
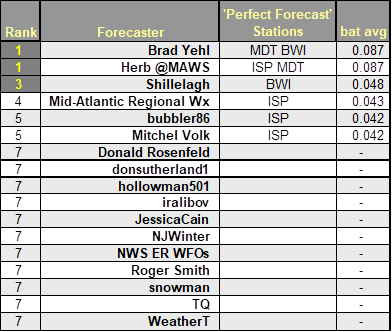
Perfect Forecasts
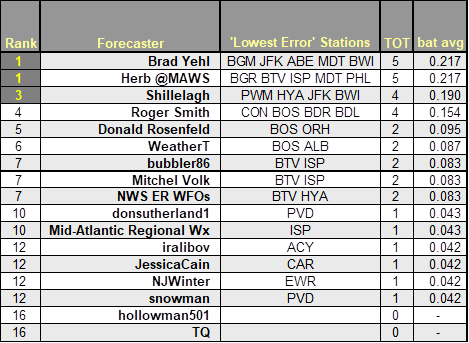
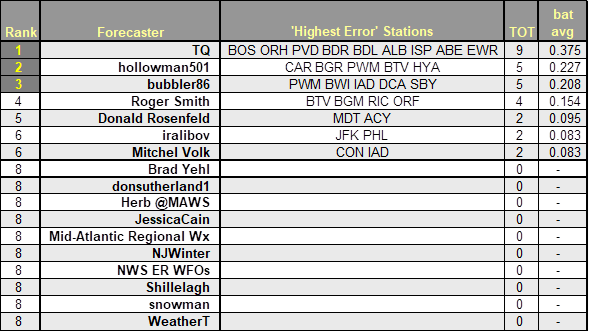
Best Station Forecasts (Batting Average - Percentage of Forecast Stations with Lowest Absolute Error)
Best Station Forecast Busts (Batting Average - Percentage of Forecast Stations with Highest Absolute Error)
Consensus forecast best @ CAR … CON … BGM … ABE
MAX forecast best @ ORH … IAD
MAX forecast less than observed @
MIN forecasts best @ BGR … ALB
MIN forecasts more than observed @
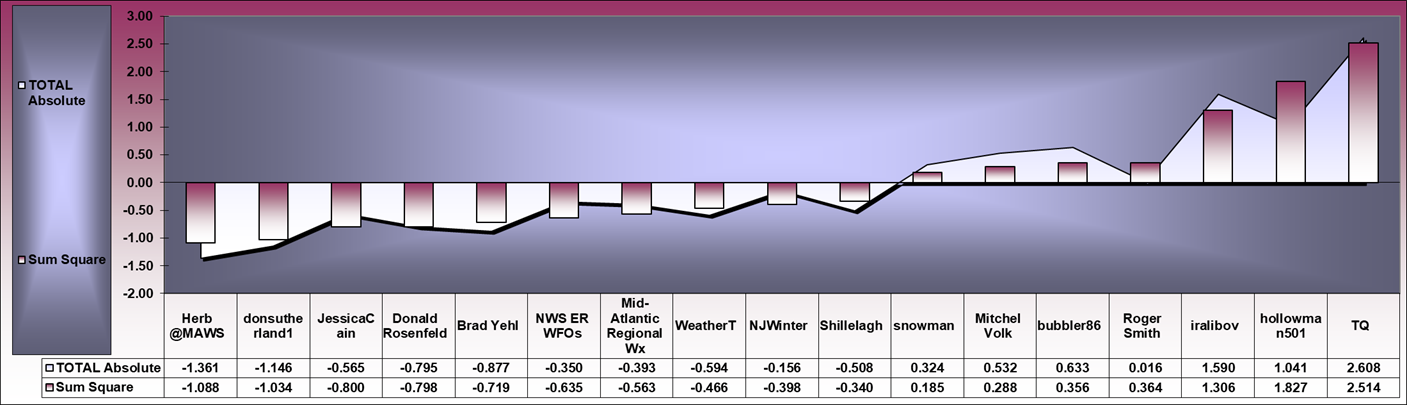
Strong correlation (R = 0.960) between SUMSQ and TAE Z-scores
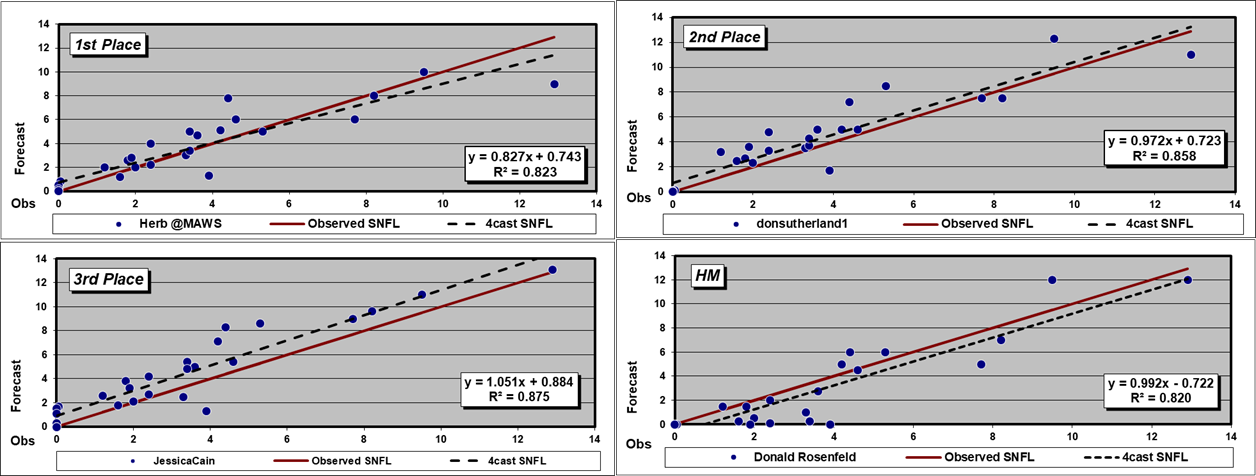
Forecast trend line above (below) red Observed snowfall line ==> over (under) forecast
R2 value indicates the how well the forecast captured the observed snowfall’s variability, i.e., R2 = 0.874 ==> the forecast captured ~87% of the observed snowfall’s variability.
*******************************
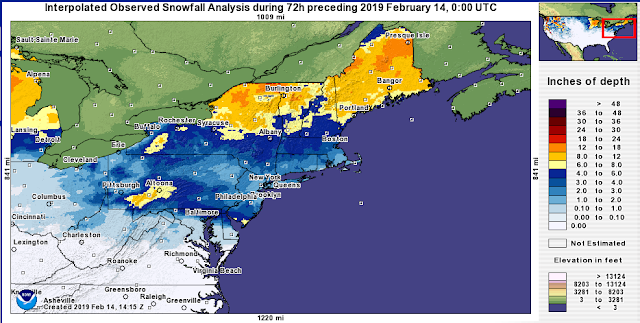
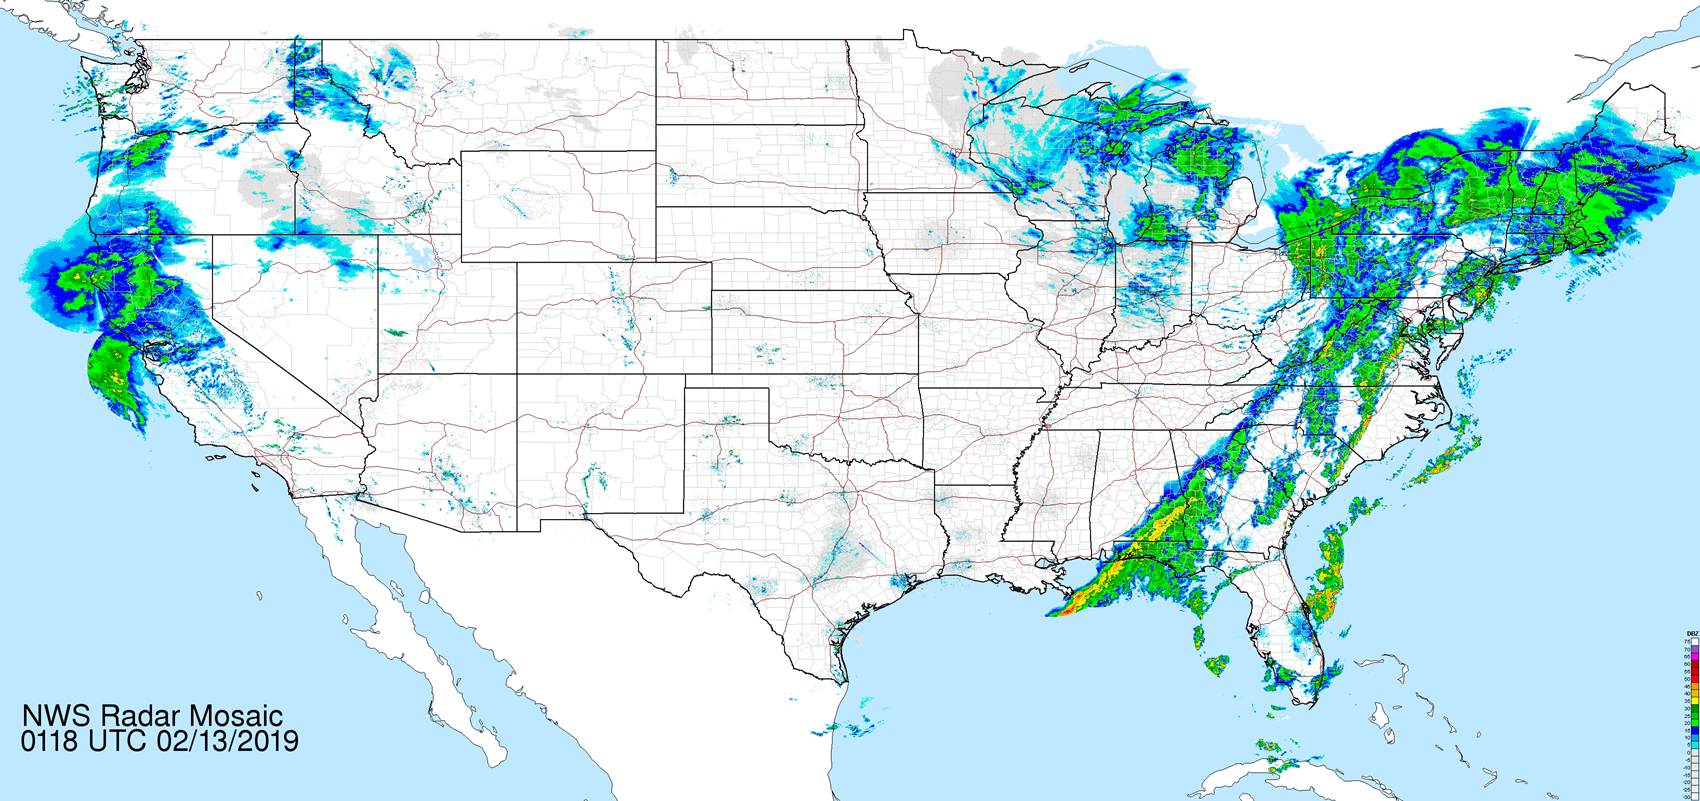
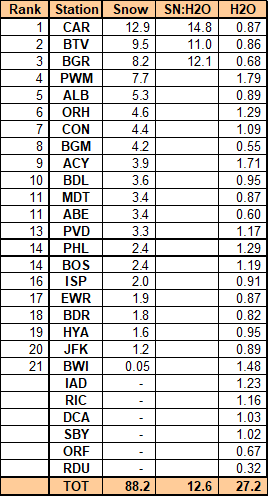
Table of verified storm-total snowfall by station from CDUS41 (CLI) ... CXUS51 (CF6) ... METARs ... and PNS bulletins.
Good coverage and reporting.
No exceptions.
HYA
STP estimated by inverse distance weighting of Barnstable county vicinity reports carried in PNSBOX.
---
Stations observing >= Trace - 21 (78%)
Given stations with measurable snowfall; stations observing at least:
4" - 8 (38%)
6" - 4 (19%)
8" - 3 (14%)
10" - 1 (5%)
Max snow melt-water (minimum SLR 10:1)
CAR - 0.87"
BTV - 0.86"
BGR - 0.68"
Max precipitation (frozen + freezing + liquid):
PWM: 1.79"
ACY - 1.71"
BWI - 1.48"
New daily record(s)
13-FEB-19
CAR - 12.9" (8.1"; 2008)
---