Complete Results @ http://www.newx-forecasts.com/

Follow the left-side link from 'Storm-total Contest Verified Forecasts’ – Contest #7 to see the complete station forecast verification table.
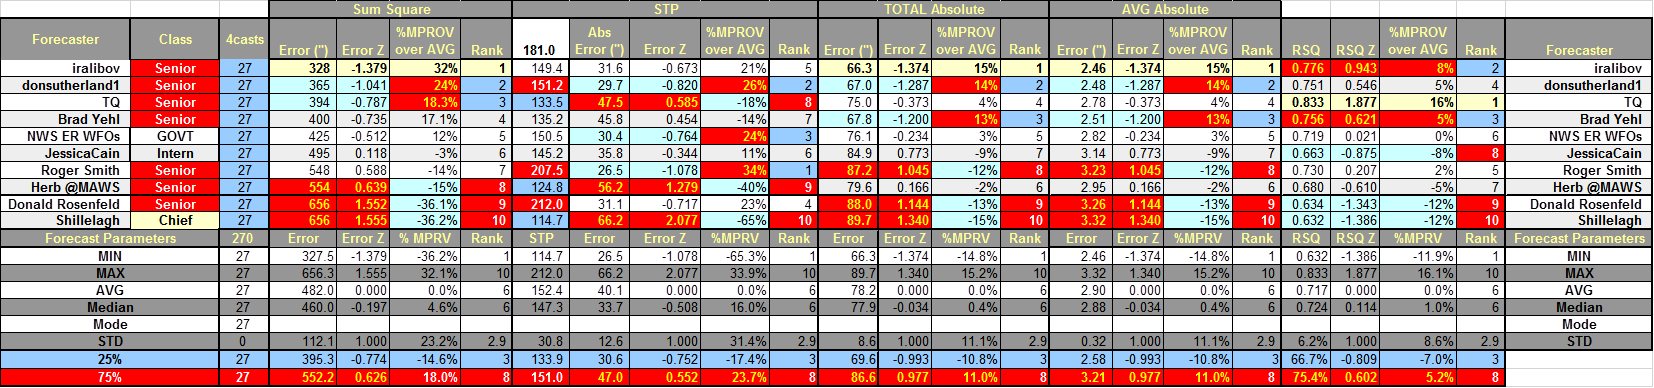
 

In the table...

Yellow cells indicate the best score in category. 

Forecast STP cells are yellow if within +/- 5% of observed STP.


Blue (Red) cells indicate the top (lower) 25% percentile.


SUMSQ:  sum of square errors

STP:  storm total precipitation

TAE:  total absolute error
AAE:  average absolute error


Final Standings - all Forecasters
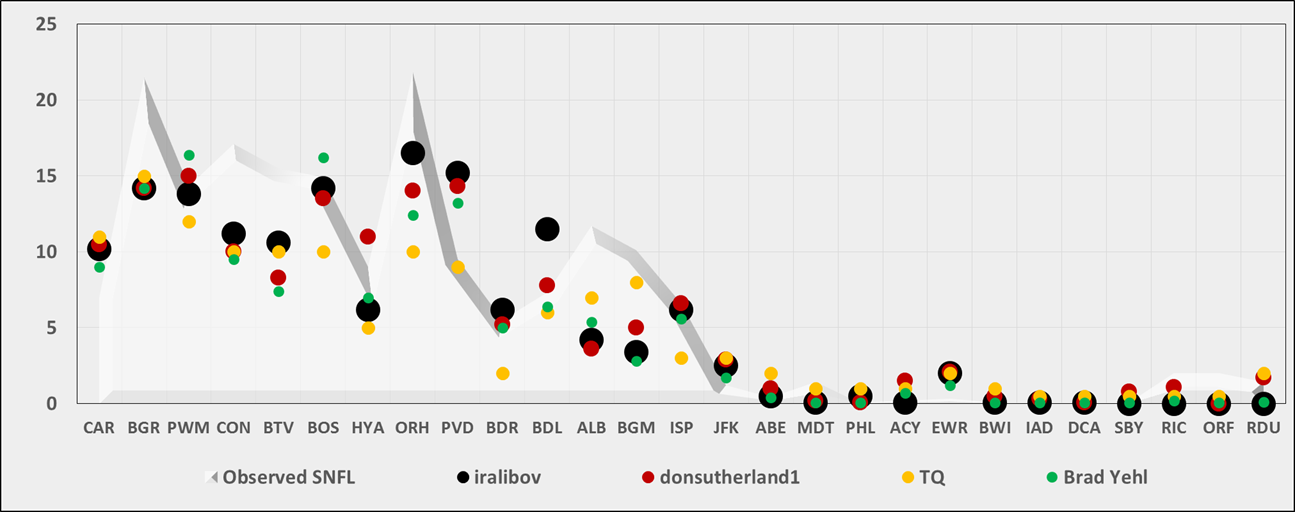
 

Station by Station 
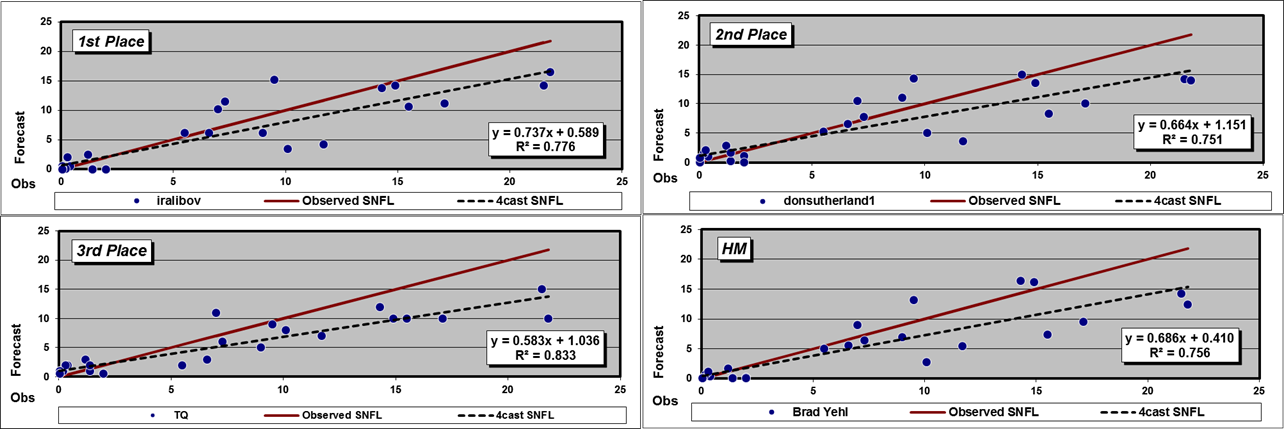
Comparison of Top Forecasters
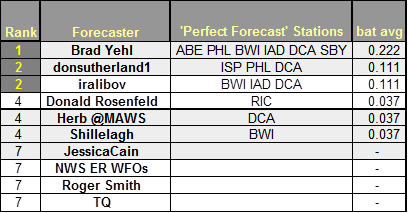
 

Perfect Forecasts


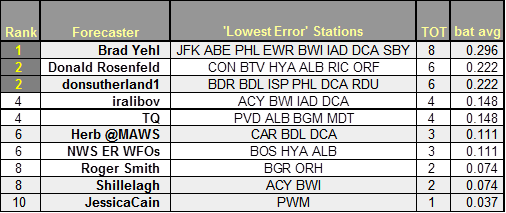
Best Station Forecasts (Batting Average - Percentage of Forecast Stations with Lowest Absolute Error)


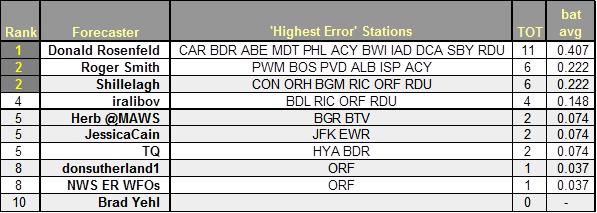
Best Station Forecast Busts (Batting Average - Percentage of Forecast Stations with Highest Absolute Error)


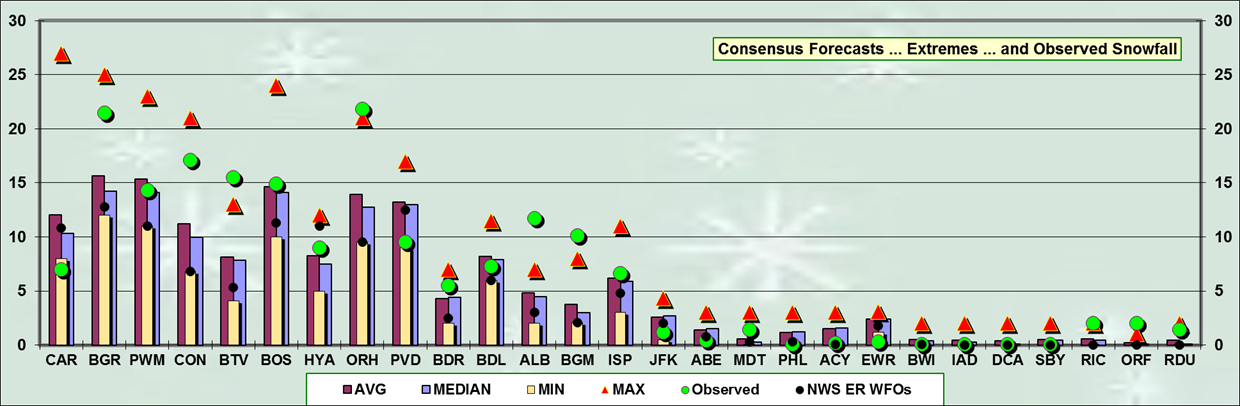
Consensus forecast best @ PWM …BOS …HYA …BDR … BDL …ISP

MAX forecast best @ BGR …CON ... ORH …BGM … RIC … RDU

MAX forecast less than observed @ BTV …ORH … ALB … BGM … ORF

MIN forecasts best @ CAR …JFK … ABE … PHL … ACY … EWR

MIN forecasts more than observed @ CAR … EWR


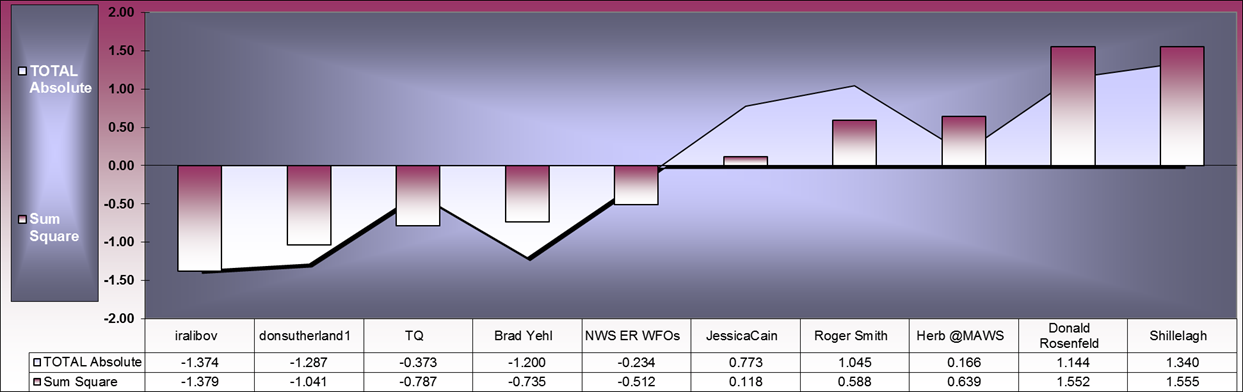
Good correlation (R = 0.920) between SUMSQ and TAE Z-scores


Data points above (below) redline ==> over (under) forecast
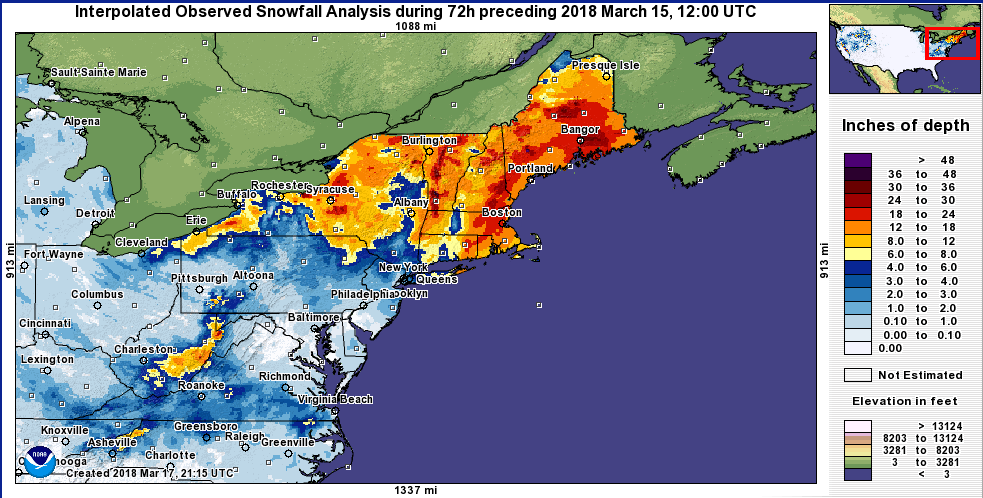
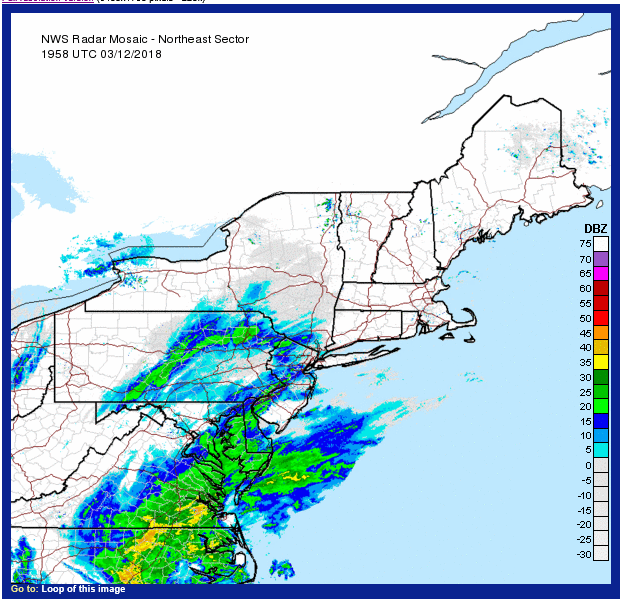
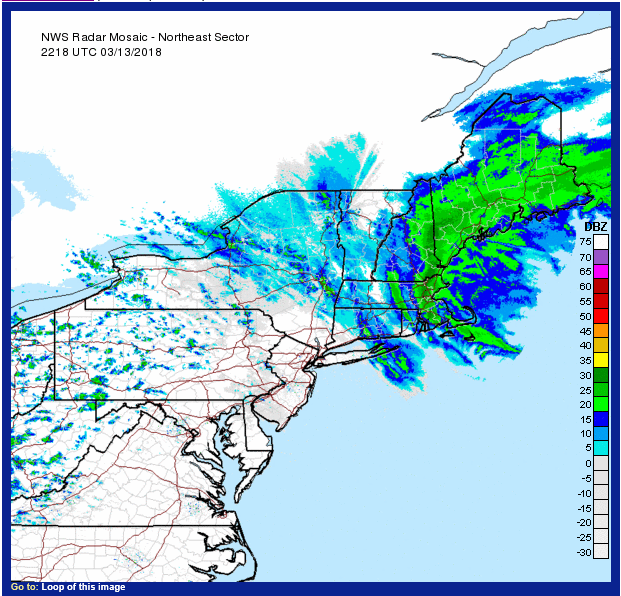
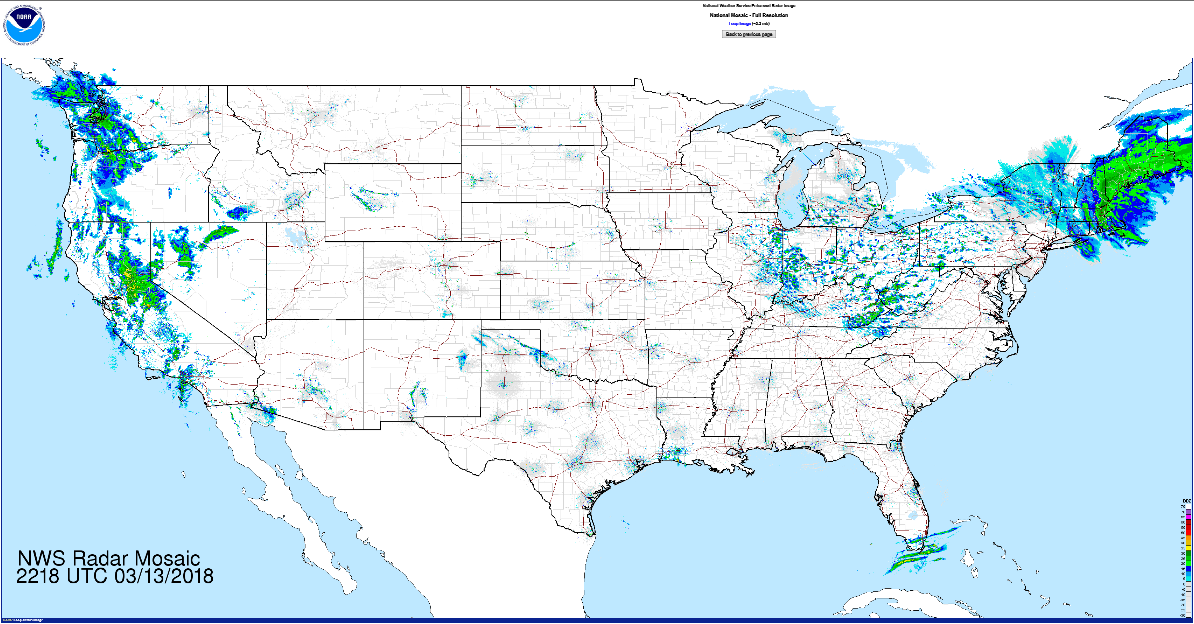
 

*******************************

Verification:

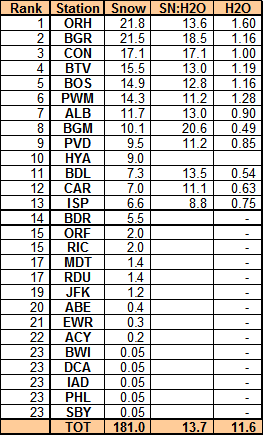
Table of preliminary storm-total snowfall by station for TUE through THU from CDUS41 (CLI) ... CXUS51 (CF6) and ... SAUS41 (METAR) bulletins.


Exceptions:  none


SLR not available for some stations reporting measureable snowfall b/c liquid and / or freezing precipitation also occurred during the verification period.


---

Stations observing at least:

Trace - 27 (100%)

4" - 14 (52%)

8" - 10 (37%)

12" - 6 (22%)

16" - 3 (11)

20" - 2 (7%)


Melt-water

ORH - 1.6"

PWM - 1.28"

BTV - 1.19"

BGR, BOS - 1.16"


Max precipitation:  ORH - 1.6"


New daily records:  13-MAR-18

ORH - 21.8" (14.8"; 1993)

BOS - 14.5" (12.3"; 1993)

PVD - 9.5" (7"; 1993)


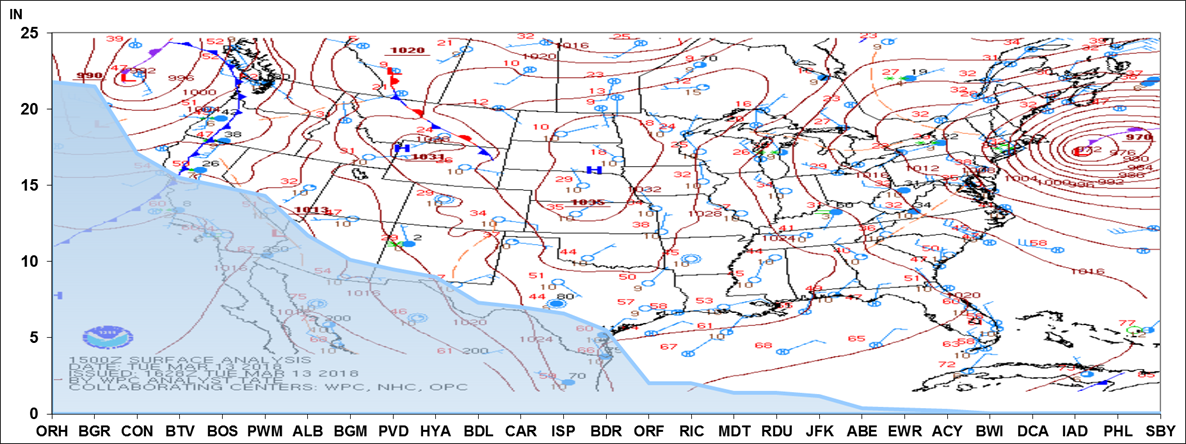
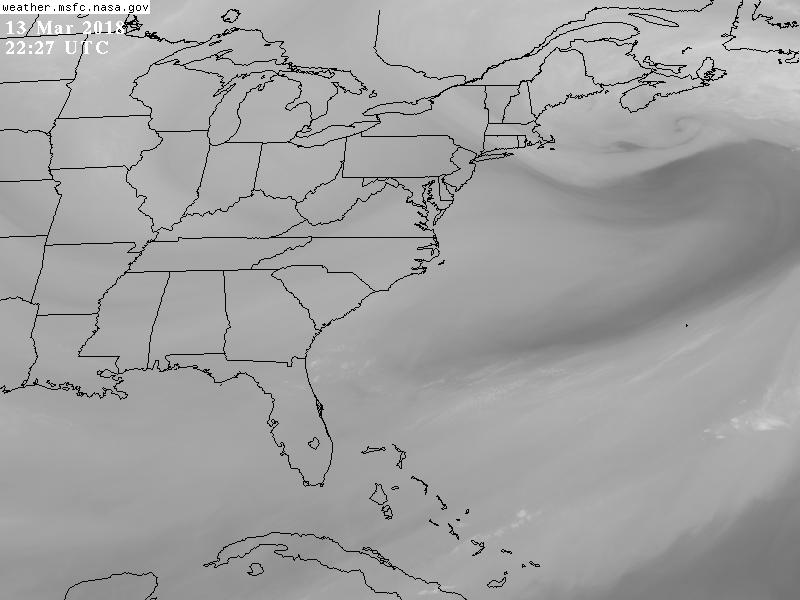
SFC analysis:  15z …TUE 13-MAR-18


http://weather.uwyo.edu/upperair/maps/2018031212.Wa.naconf.gif


http://weather.uwyo.edu/upperair/maps/2018031300.Wa.naconf.gif


http://weather.uwyo.edu/upperair/maps/2018031312.Wa.naconf.gif


http://weather.uwyo.edu/upperair/maps/2018031212.850a.naconf.gif


http://weather.uwyo.edu/upperair/maps/2018031212.850a.naconf.gif


http://weather.uwyo.edu/upperair/maps/2018031312.850a.naconf.gif


http://weather.uwyo.edu/upperair/maps/2018031400.850a.naconf.gif


http://weather.uwyo.edu/upperair/maps/2018031412.850a.naconf.gif


http://weather.uwyo.edu/upperair/maps/2018031500.850a.naconf.gif


http://weather.uwyo.edu/upperair/maps/2018031512.850a.naconf.gif


http://weather.uwyo.edu/upperair/maps/2018031212.700a.naconf.gif


http://weather.uwyo.edu/upperair/maps/2018031300.700a.naconf.gif


http://weather.uwyo.edu/upperair/maps/2018031312.700a.naconf.gif


http://weather.uwyo.edu/upperair/maps/2018031400.700a.naconf.gif


http://weather.uwyo.edu/upperair/maps/2018031412.700a.naconf.gif


http://weather.uwyo.edu/upperair/maps/2018031500.700a.naconf.gif


http://weather.uwyo.edu/upperair/maps/2018031512.700a.naconf.gif


http://weather.uwyo.edu/upperair/maps/2018031212.500a.naconf.gif


http://weather.uwyo.edu/upperair/maps/2018031300.500a.naconf.gif


http://weather.uwyo.edu/upperair/maps/2018031312.500a.naconf.gif


http://weather.uwyo.edu/upperair/maps/2018031400.500a.naconf.gif


http://weather.uwyo.edu/upperair/maps/2018031412.500a.naconf.gif


http://weather.uwyo.edu/upperair/maps/2018031500.500a.naconf.gif


http://weather.uwyo.edu/upperair/maps/2018031512.500a.naconf.gif


http://weather.uwyo.edu/upperair/maps/2018031212.300a.naconf.gif


http://weather.uwyo.edu/upperair/maps/2018031300.300a.naconf.gif


http://weather.uwyo.edu/upperair/maps/2018031312.300a.naconf.gif


http://weather.uwyo.edu/upperair/maps/2018031400.300a.naconf.gif


http://weather.uwyo.edu/upperair/maps/2018031412.300a.naconf.gif


http://weather.uwyo.edu/upperair/maps/2018031500.300a.naconf.gif


http://weather.uwyo.edu/upperair/maps/2018031512.300a.naconf.gif


http://weather.uwyo.edu/upperair/maps/2018031412.100a.nh.gif


http://weather.uwyo.edu/upperair/maps/2018031412.10a.nh.gif