Complete Results @ http://www.newx-forecasts.com/
Follow the left-side link from 'Storm-total Contest Verified Forecasts’ – Contest #3 to see the complete station forecast verification table.
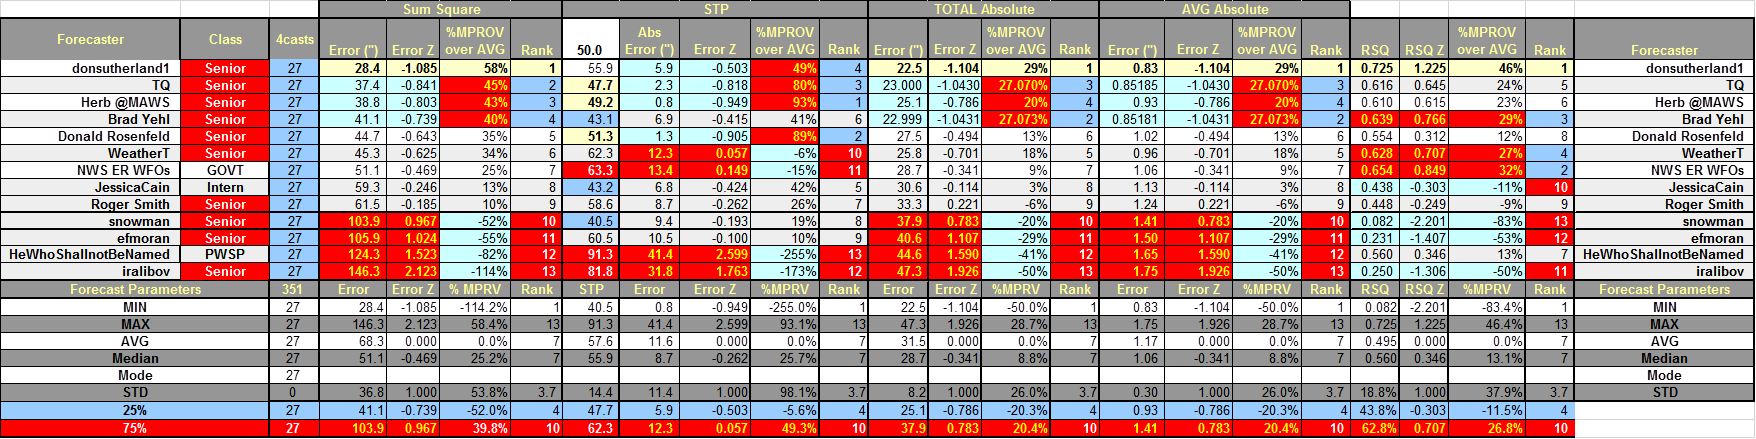
In the table...
Yellow cells indicate the best score in category.
Forecast STP cells are yellow if within +/- 5% of observed STP.
Blue (Red) cells indicate the top (lower) 25% percentile.
SUMSQ: sum of square errors
STP: storm total precipitation
TAE: total absolute
error
AAE: average absolute error
Final Standings - all Forecasters
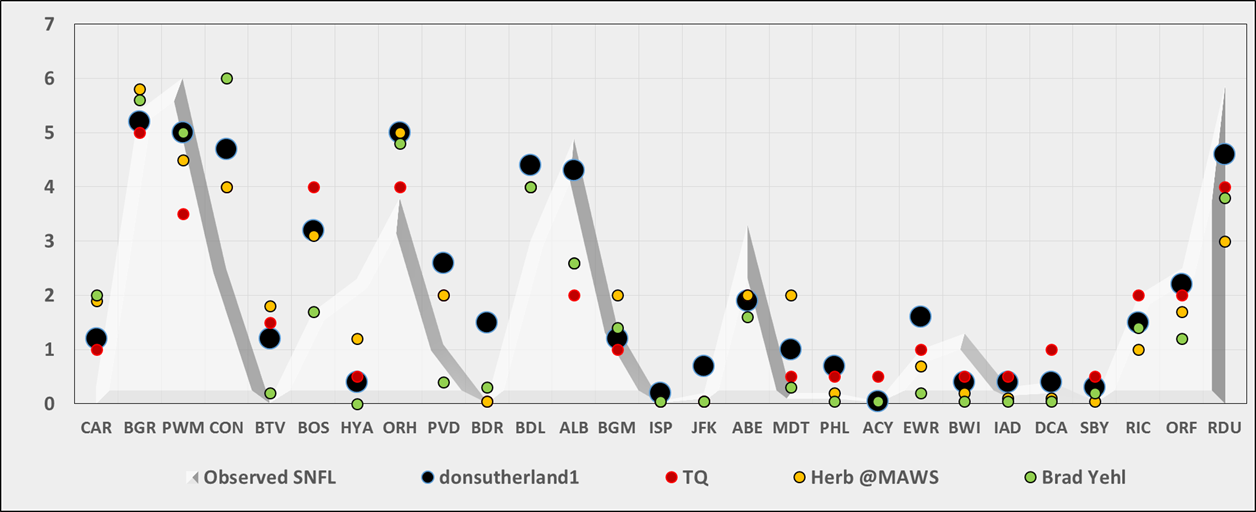
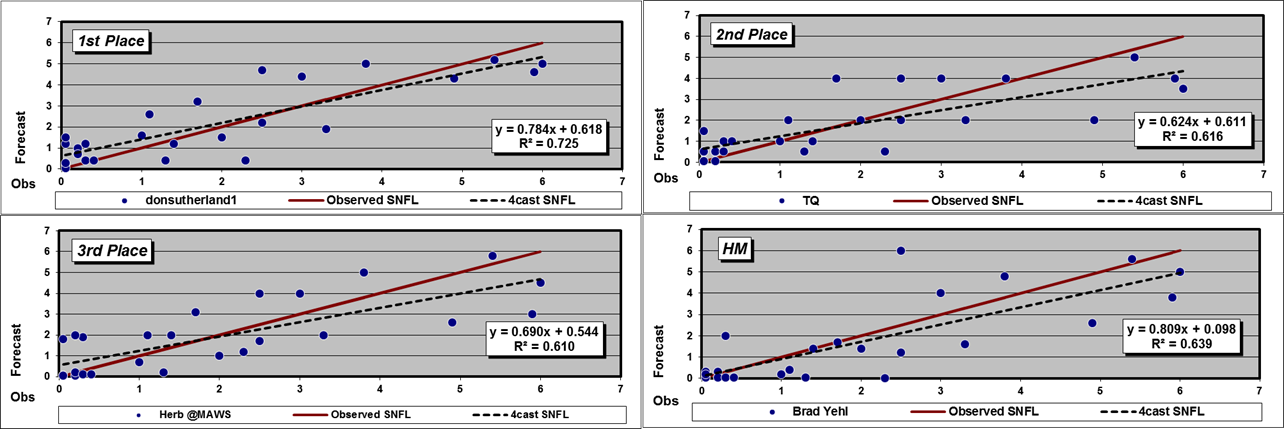
Station by Station Comparison
of Top Forecasters
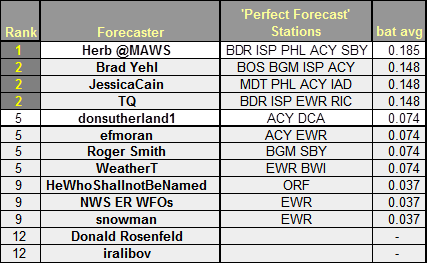
Perfect Forecasts
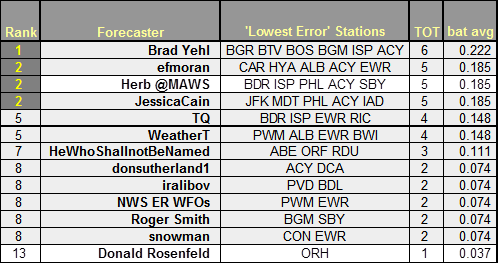
Best Station Forecasts (Batting Average - Percentage of Forecast Stations with Lowest Absolute Error)
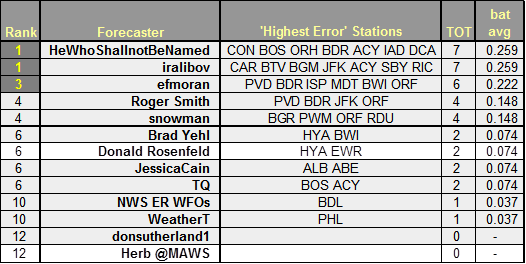
Best Station Forecast Busts (Batting Average - Percentage of Forecast Stations with Highest Absolute Error)
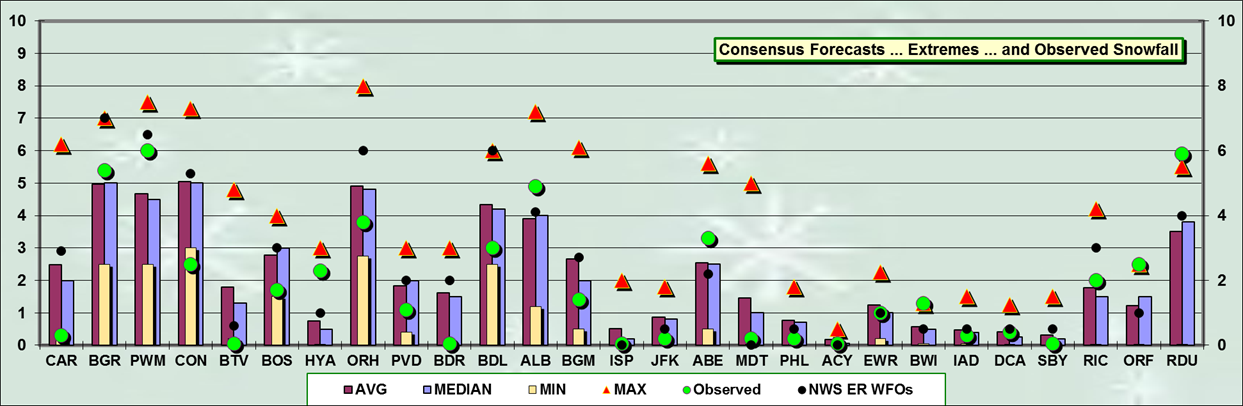
Consensus forecast best @ BGR … EWR … IAD … DCA … RIC
MAX forecast best @ ORF … RDU
MAX forecast less than observed @ RDU
MIN forecasts best @ CAR … CON … BTV … BOS … BDR … BDL … ISP … JFK …MDT … PHL
MIN forecasts more than observed @ CON
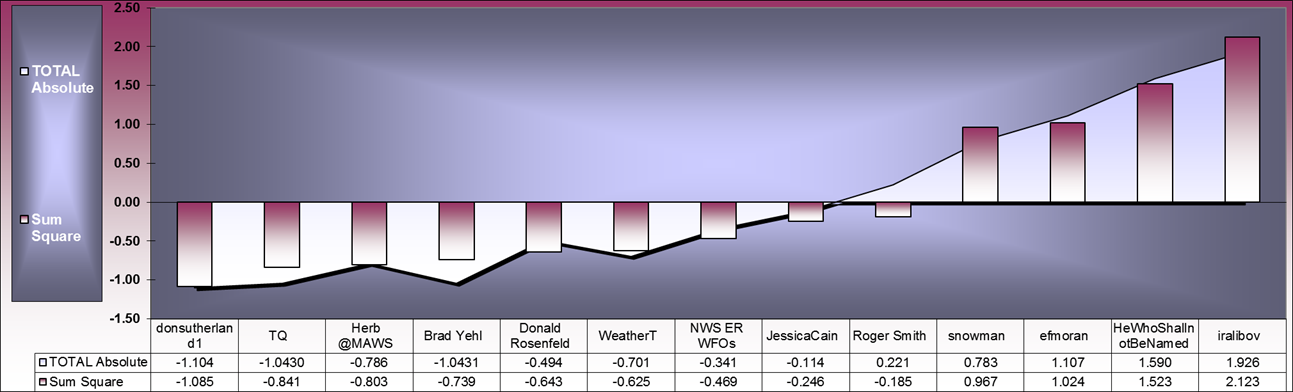
Good correlation between SUMSQ and TAE Z-scores
*******************************
Verification:
Good data from CLI and F6 bulletins.
Exceptions
HYA
Estimated storm-total snowfall based on inverse distance
weighting technique using vicinity STP reports from Barnstable County carried
in PNSBOX.
BOS
All frozen precipitation. Low SLR due likely to 2M temperatures > 0°C.
CON
CON/s STP based on a 10:1 SLR is clearly unsupported by other data; however ... there have been more than a few instances over time where STPs for other stations indicate obviously bogus 10:1 SLRs but that/s been their report and we/ve use it.
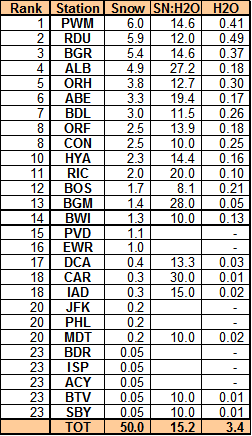
Stations observing
at least:
Trace - 27
4" - 4 (19%)
6" - 1 (4%)
8" - 0
Max melt-water at RDU (0.49")
PWM - 0.41"
BGR - 0.37"
New Daily Records:
RDU - 5.9"
(4"; 1946)
ORF - 2.5"
(1.8"; 1911)
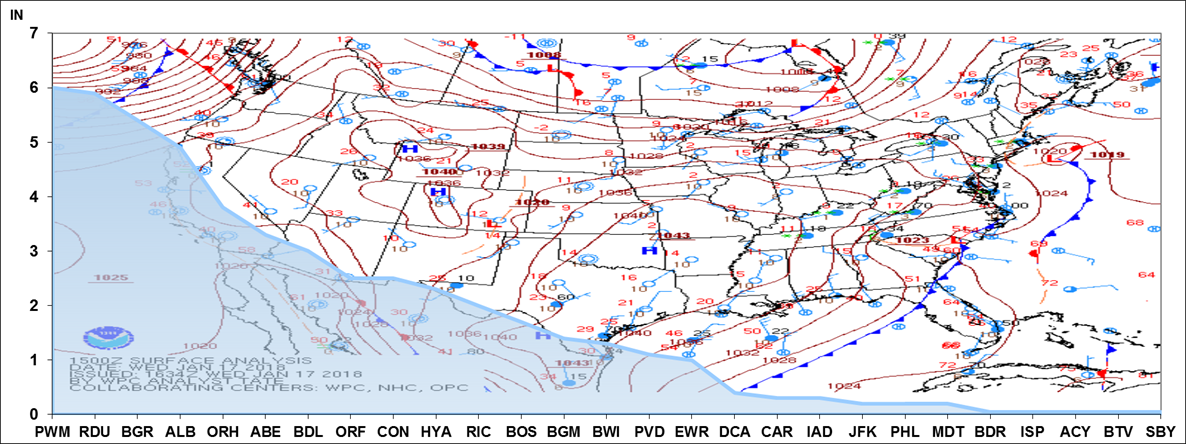
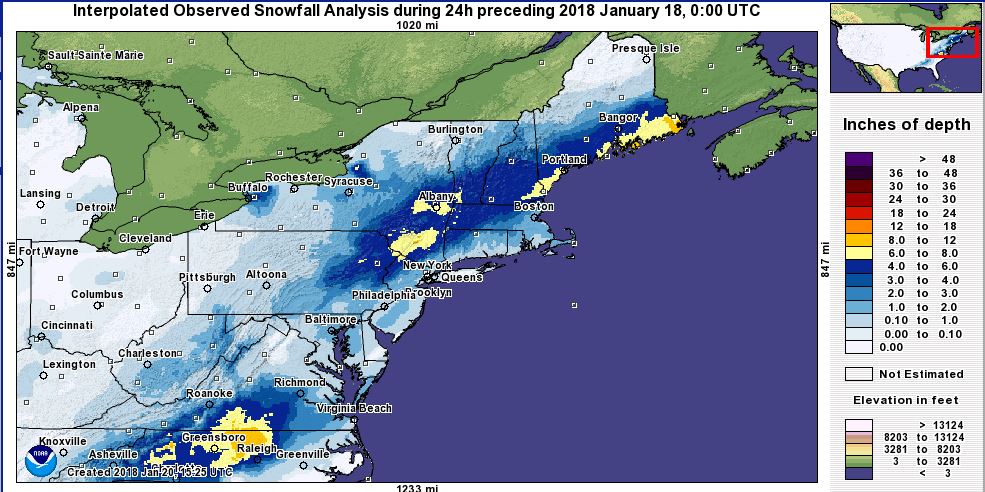
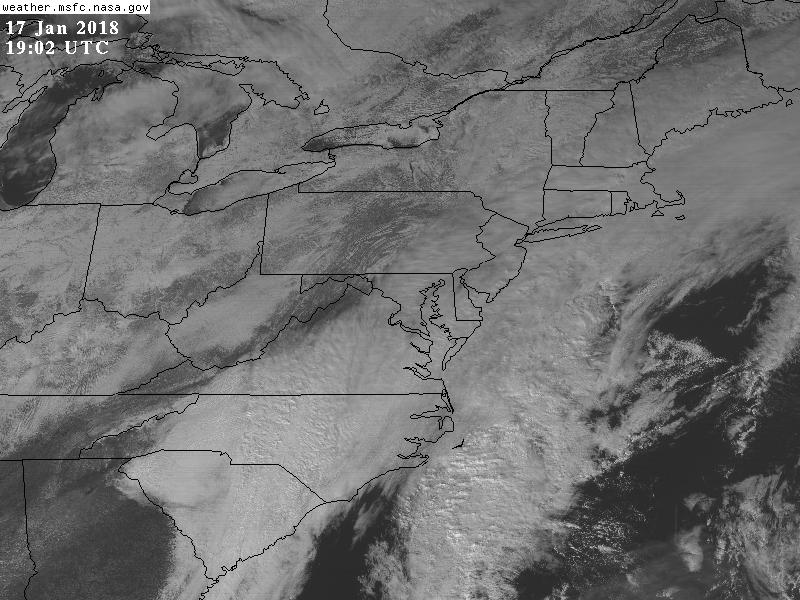
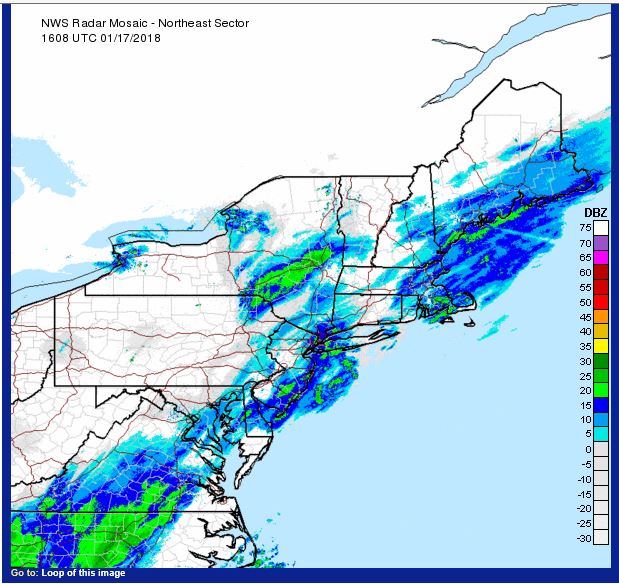
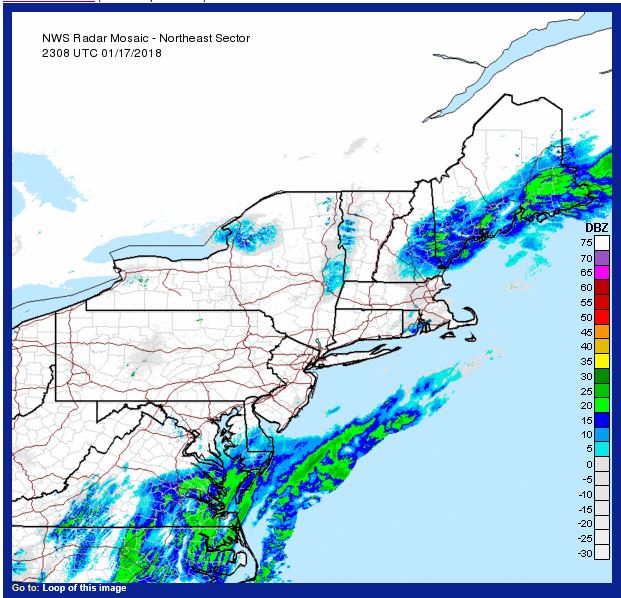
Image doesn’t
capture late verification period snows over RDU across to ORF.
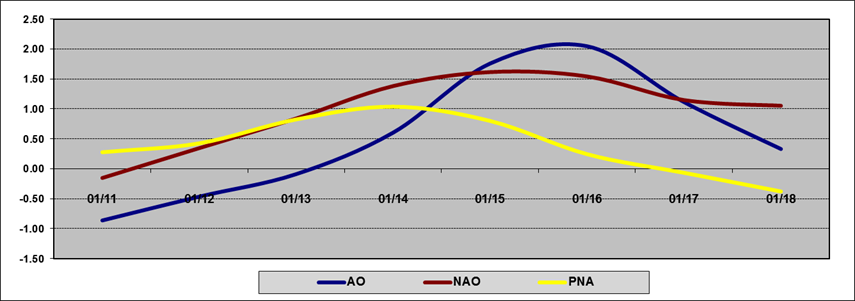
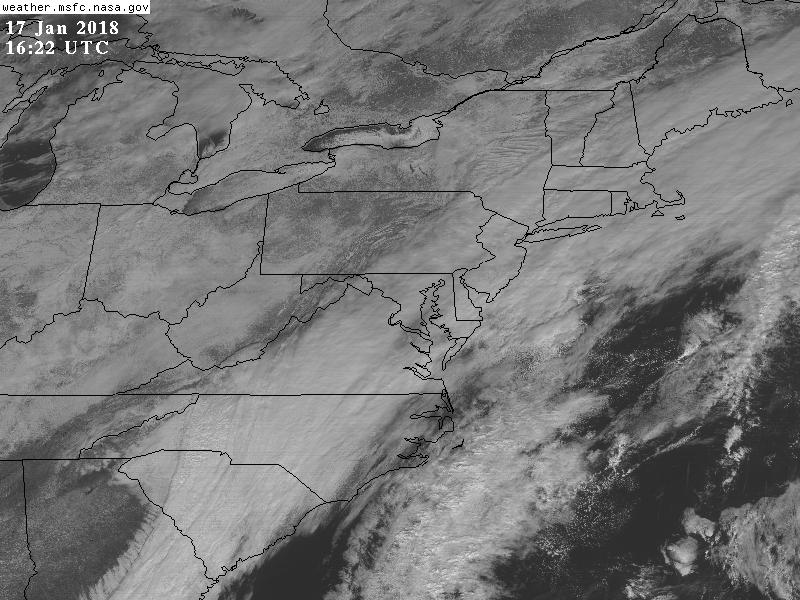
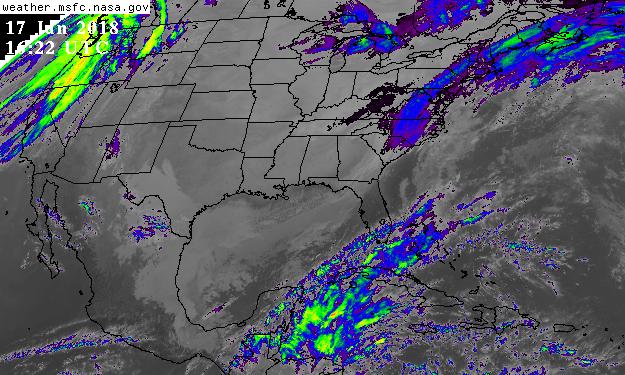
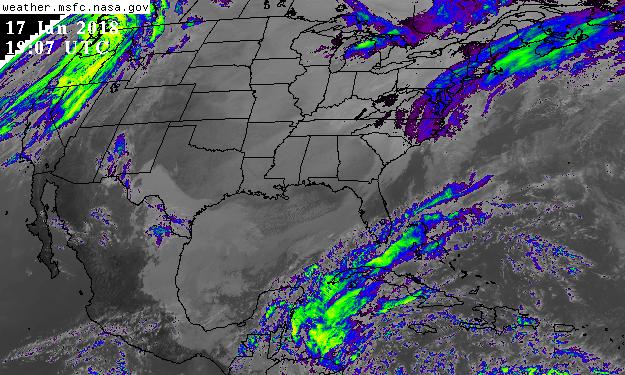
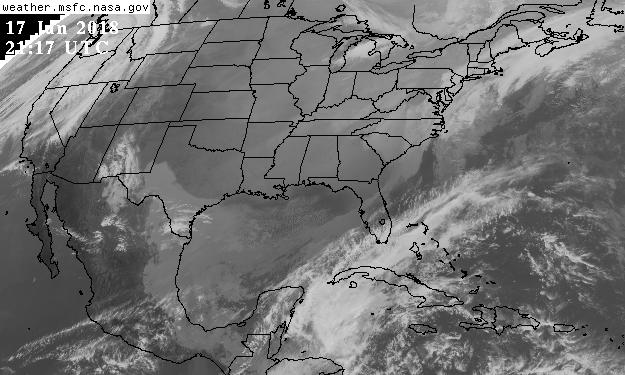
Teleconnections

Limited imagery b/c
MSFC switched to GOES16 sometime after the 04-JAN-17 snow storm and subsequently
clobbered every ‘make your own view’ link on file.