Complete Results @ http://www.newx-forecasts.com/
Follow the left-side link from 'Storm-total Contest Verified Forecasts’ –Storm #1 to see the complete station forecast verification table.
In the table...
Yellow cells indicate the best score in category.
Forecast STP cells are yellow if within +/- 5% of observed STP.
Blue (Red) cells indicate the upper (lower) 25% percentile.
SUMSQ: sum of square errors
STP: storm total precipitation
TAE: total absolute
error
AAE: average absolute error
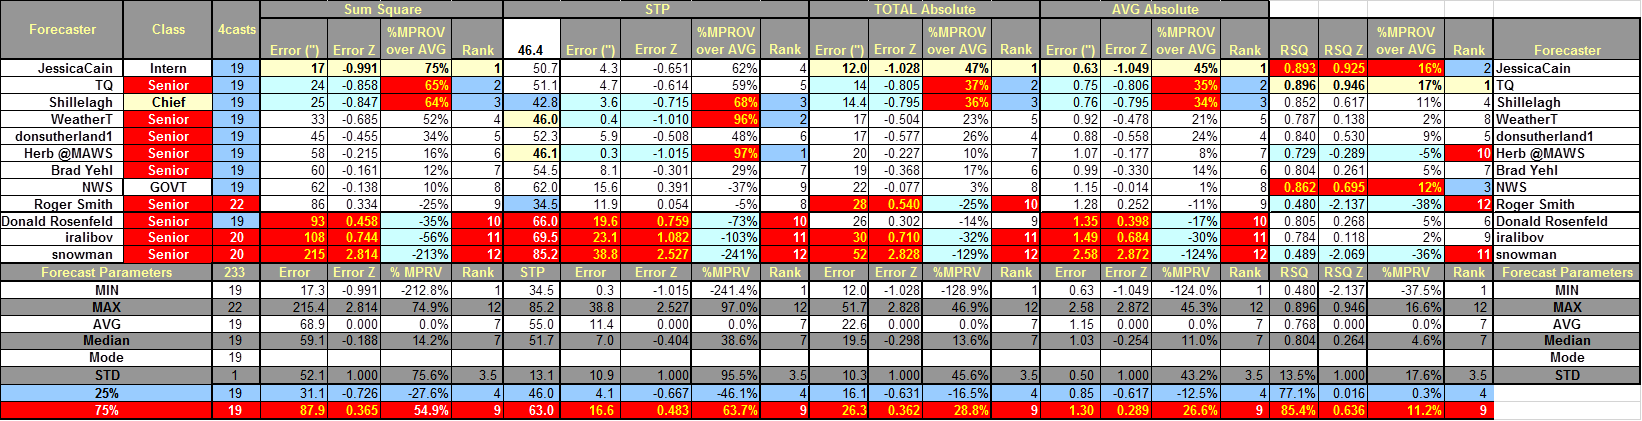
Final Standings - all Forecasters
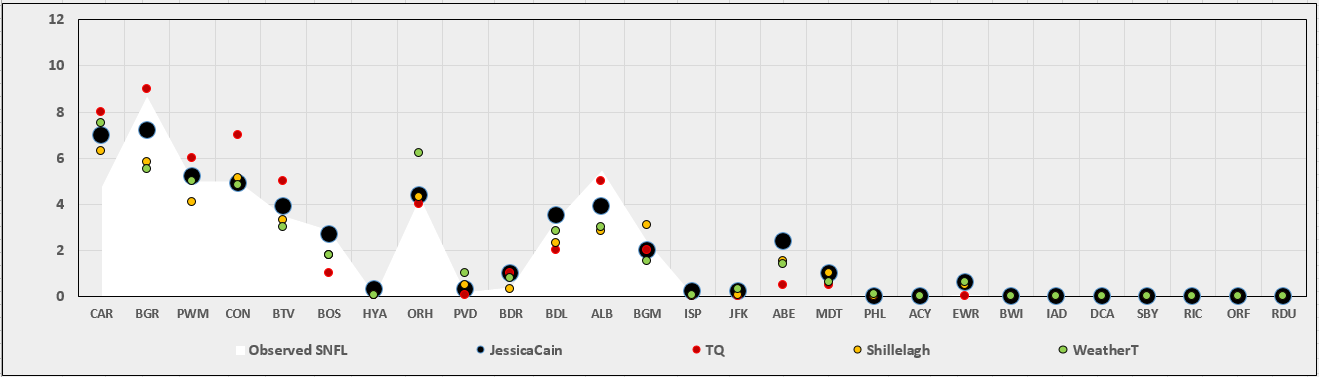
Station Comparison of
Top Forecasters
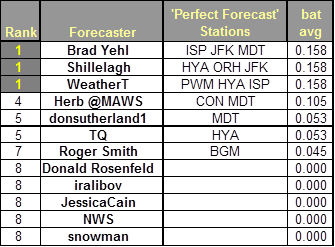
Perfect Forecasts
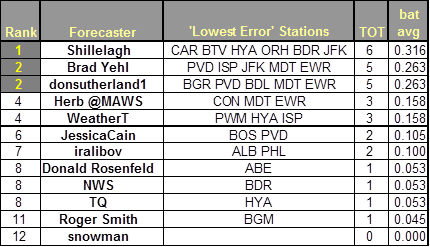
Best Station Forecasts (Batting Average - Percentage of Forecast Stations with Lowest Absolute Error)
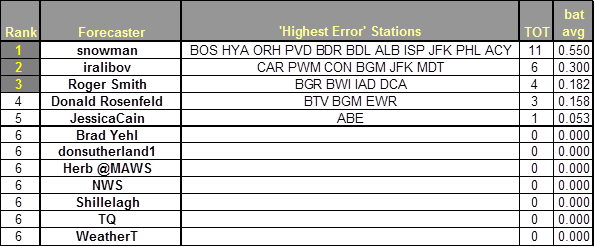
Best Station Forecast Busts (Batting Average - Percentage of Forecast Stations with Highest Absolute Error)
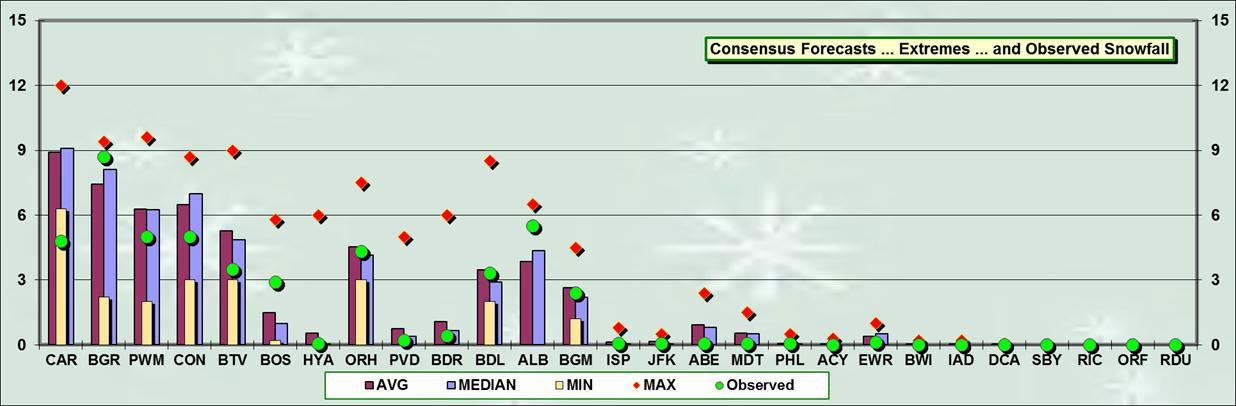
Consensus forecast best @ ORH … BDL … BGM
MAX forecast best @ BGR … ALB
MAX forecast less than observed @
MIN forecasts best @ CAR … BTV
MIN forecasts more than observed @ CAR
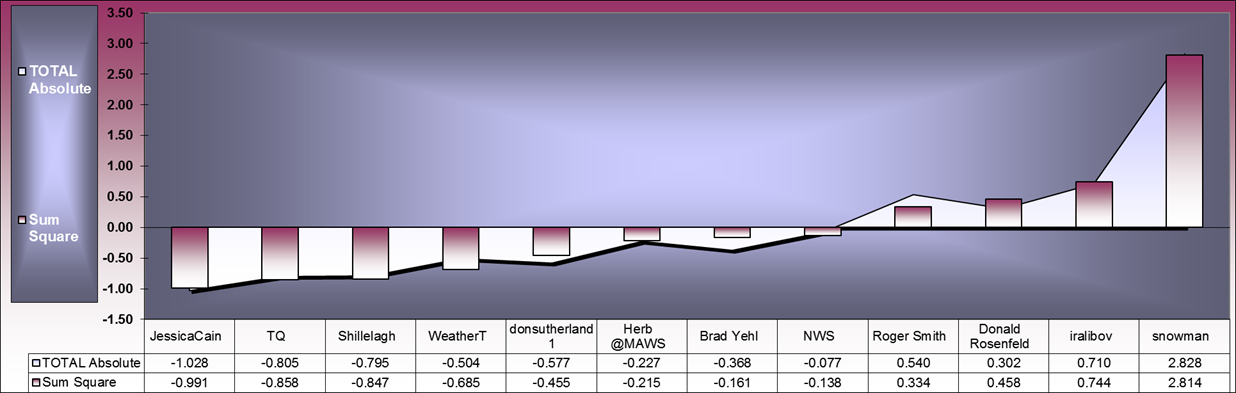
Good association between SUMSQ and TAE Z-scores
*******************************
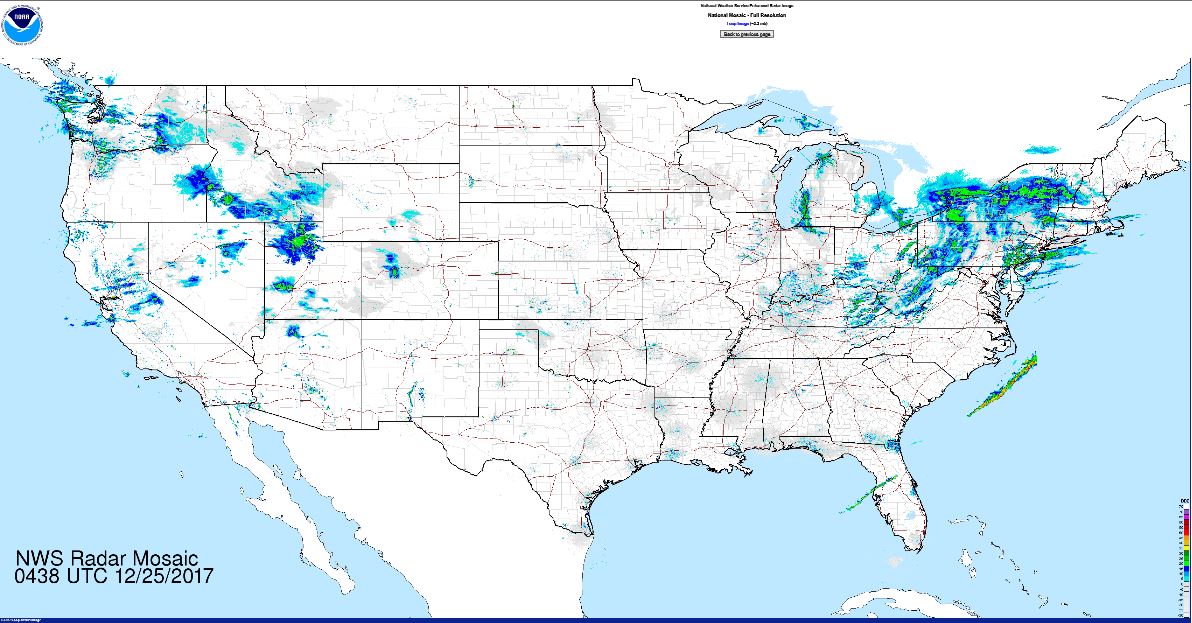
Verification:
Good data from CDUS41 … PNS … and F6 bulletins.
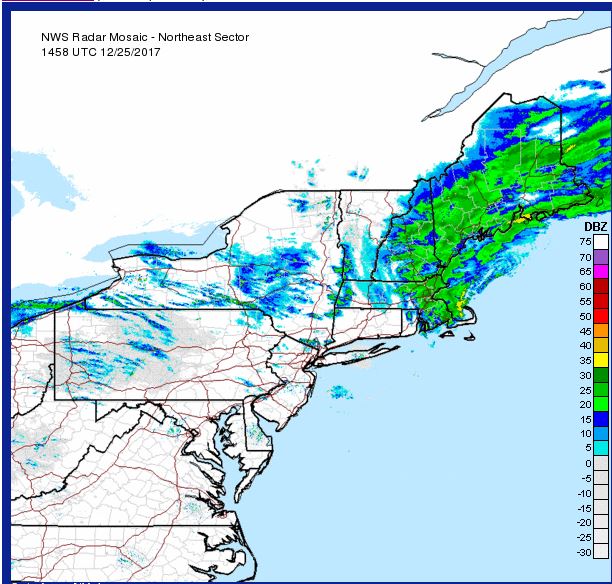
HYA
Storm-total snowfall report based on METARs
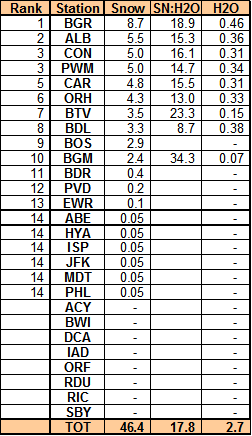
Stations observing at least:
Trace - 19
4" - 6
6" - 1
8" - 1
10" - 0
Max melt-water at BGR (0.46")
Snow-Liquid Ratios (SLR) for areas with mixed precipitation ... such as BDR and BOS ... are not reported.
New Daily Records:
None
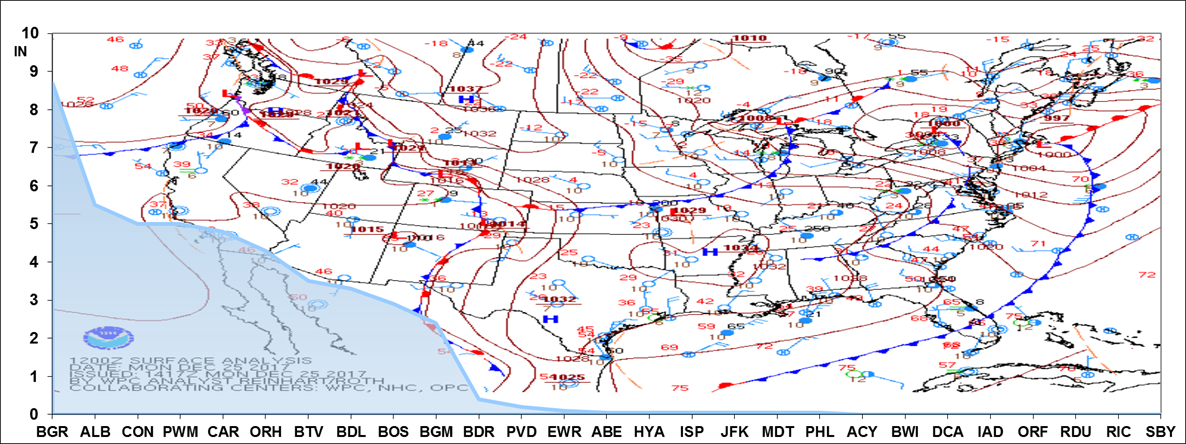
12z 25-Dec-17
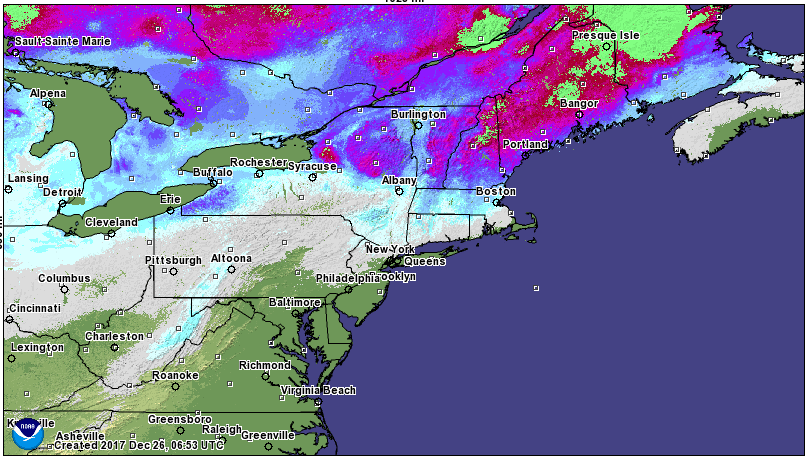
NOHRSC modeled snow depth