Complete Results @ http://www.newx-forecasts.com/
Follow the left-side link from 'Storm-total Contest Verified Forecasts’ – Contest #3 to see the complete station forecast verification table.
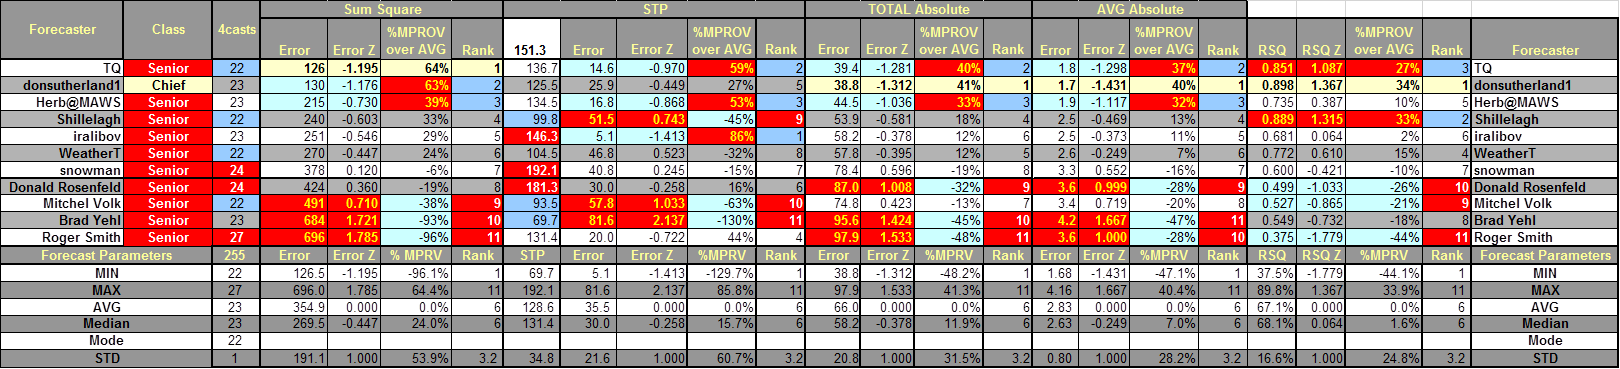
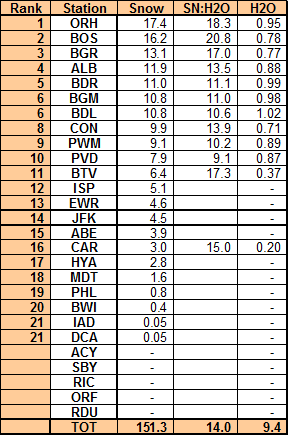
In the table...
Yellow cells indicate the best score in category.
Forecast STP cells are yellow if within +/- 5% of observed STP.
Blue (Red) cells indicate the top (lower) 25% percentile.
SUMSQ: sum of square errors
STP: storm total precipitation
TAE: total absolute
error
AAE: average absolute error
Final Standings - all Forecasters
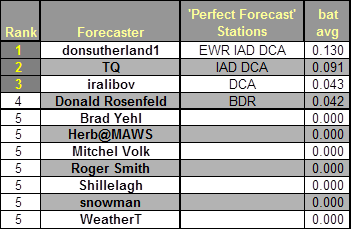
Perfect Forecasts
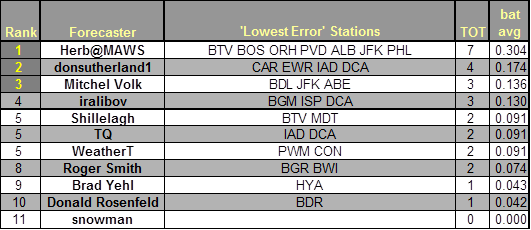
Best Station Forecasts (Batting Average - Percentage of Forecast Stations with Lowest Absolute Error)
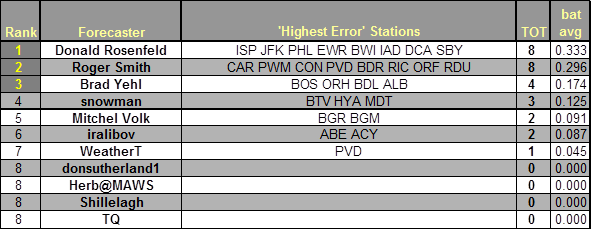
Best Station Forecast Busts (Batting Average - Percentage of Forecast Stations with Highest Absolute Error)
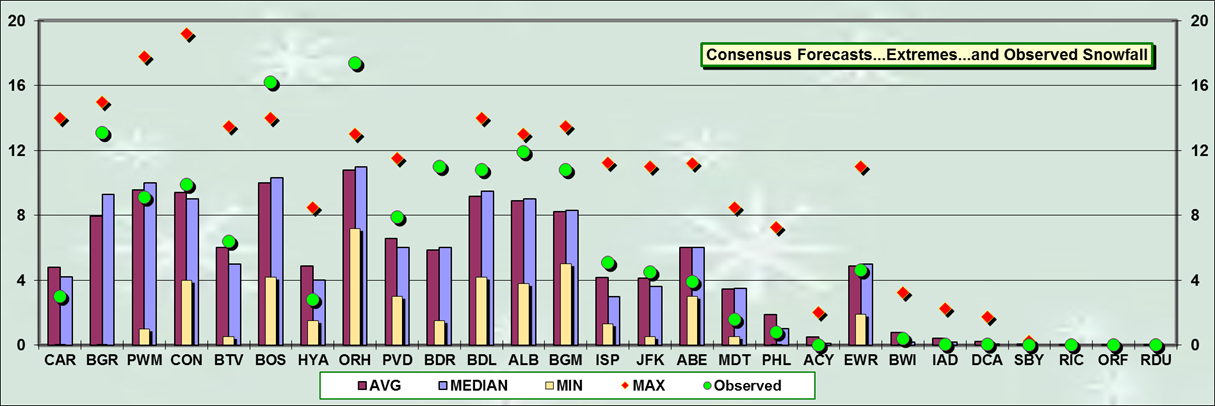
Consensus forecast best @ PWM …CON …BTV …JFK …EWR
MAX forecast best @ BGR …BOS …ORH …BDR … ALB
MAX forecast less than observed @ BOS …ORH
MIN forecasts best @ MDT
MIN forecasts more than observed @ none
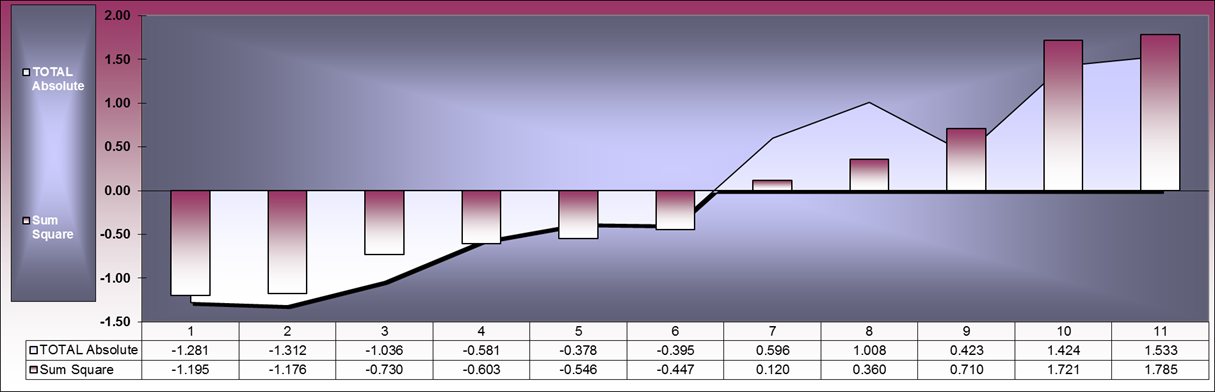
Good association between SUMSQ and TAE Z-scores
*******************************
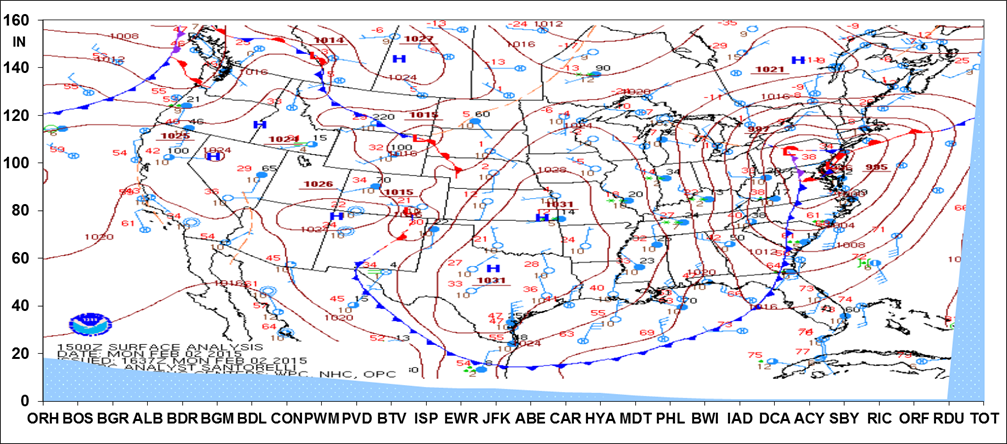
Verification:
Good data from CDUS41 … PNS … and CF6 bulletins.
New Daily Records:
MON …02-FEB-15
BOS - 16.2"
(11.1"; 1974)
BGR - 12.3"
(10.7"; 2011)
ALB - 11.9"
(5.5"; 1982)
ORF - 11.4"
(8.4"; 1974)
BDL - 10.8"
(6.5"; 1916)
BDR - 10.3"
(3.2"; 1985)
CON - 9.9"
(8.4"; 1967)
BGM - 8.8"
(6.8"; 1956)
PVD - 7.9"
(6.5"; 1984)
IAD - 4.9"
(3.5"; 1996)
EWR - 4.2"
(3.4"; 1985)
JFK - 4.2"
(3.3"; 1985)
---