Complete Results @ http://www.newx-forecasts.com/
Follow the left-side link from 'Storm-total Contest Verified Forecasts’ – Contest #2 to see the complete station forecast verification table.
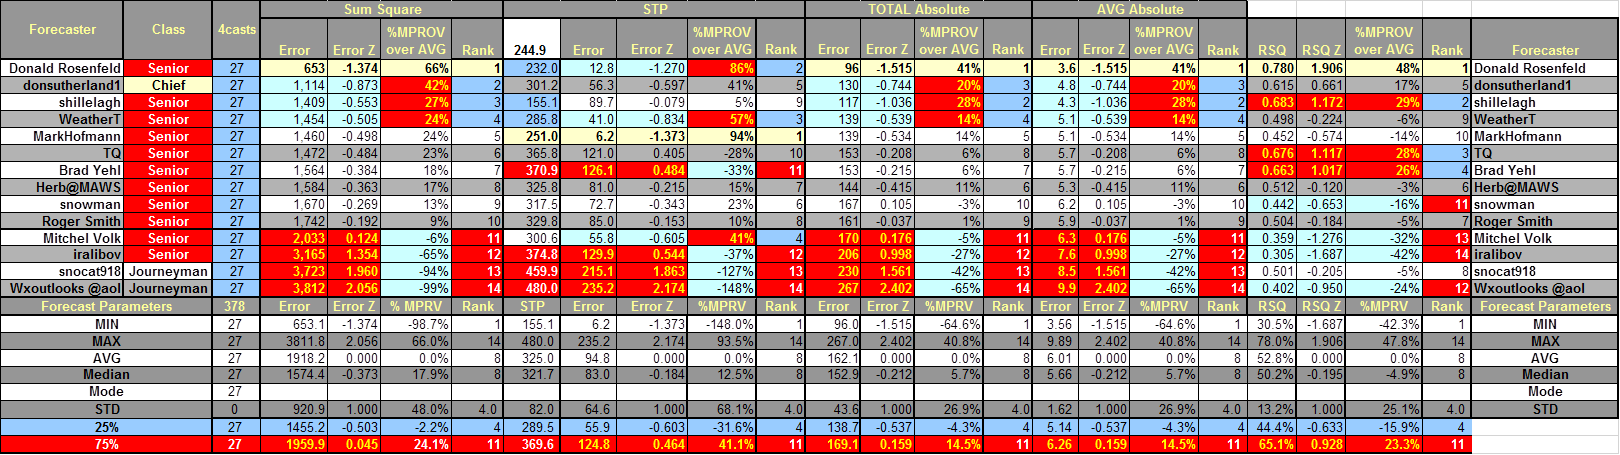
In the table...
Yellow cells indicate the best score in category.
Forecast STP cells are yellow if within +/- 5% of observed STP.
Blue (Red) cells indicate the top (lower) 25% percentile.
SUMSQ: sum of square errors
STP: storm total precipitation
TAE: total absolute
error
AAE: average absolute error
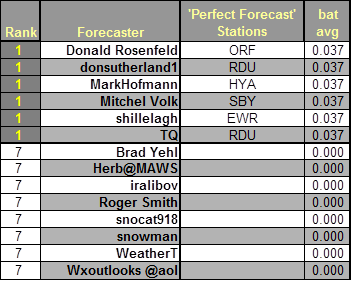
Final Standings - all Forecasters
Perfect Forecasts
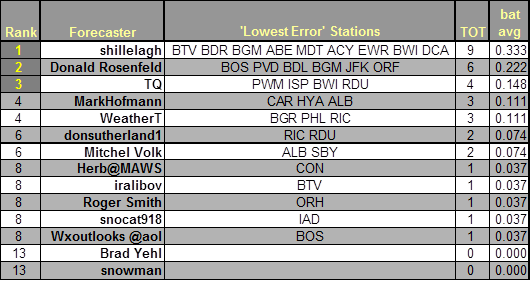
Best Station Forecasts (Batting Average - Percentage of Forecast Stations with Lowest Absolute Error)
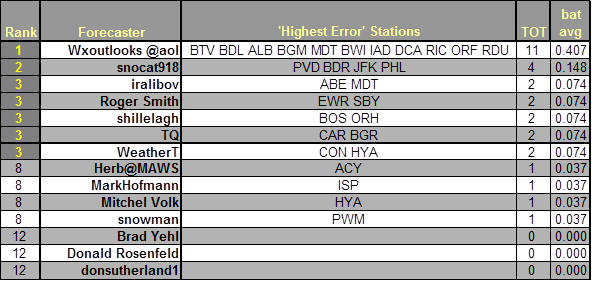
Best Station Forecast Busts (Batting Average - Percentage of Forecast Stations with Highest Absolute Error)
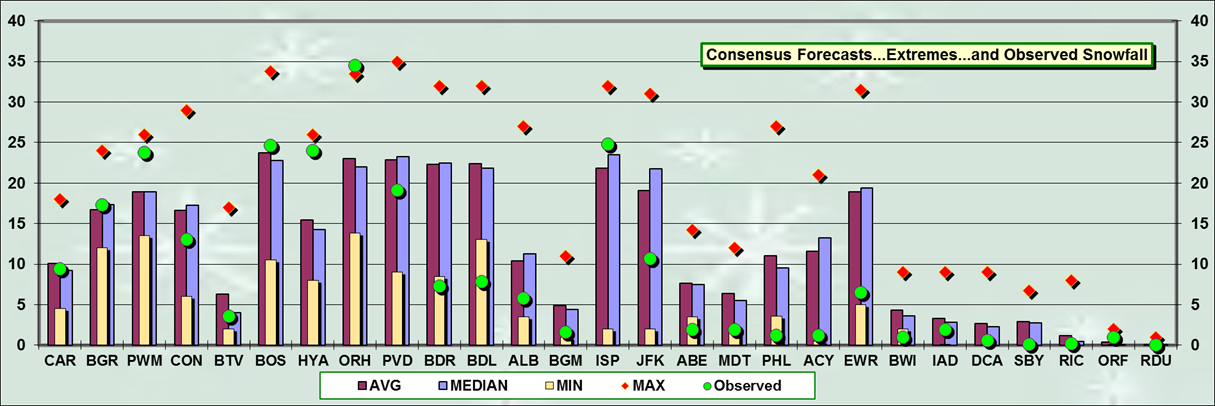
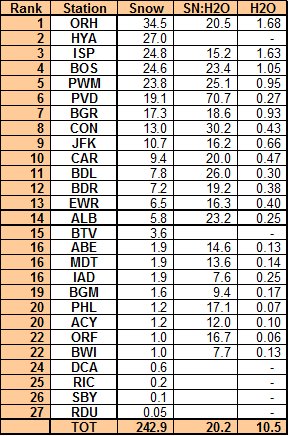
Consensus forecast best @ CAR … BGR … BOS
MAX forecast best @ PWM … HYA … ORH
MAX forecast less than observed @ ORH
MIN forecasts best @ BDR …BDK … ALB …BGM …ABE …MDT …PHL … ACY … EWR … BWI
MIN forecasts more than observed @ BDR … BDL … ABE ... PHL ... BWI
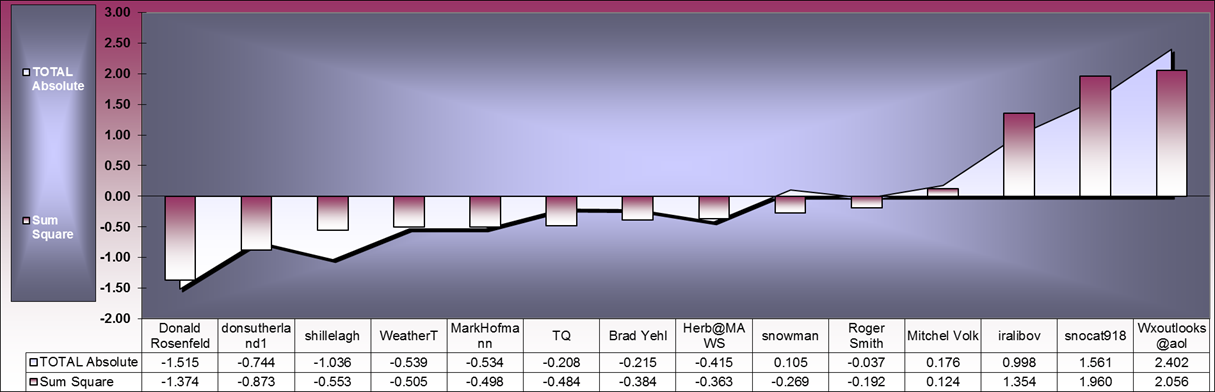
Good association between SUMSQ and TAE Z-scores
*******************************
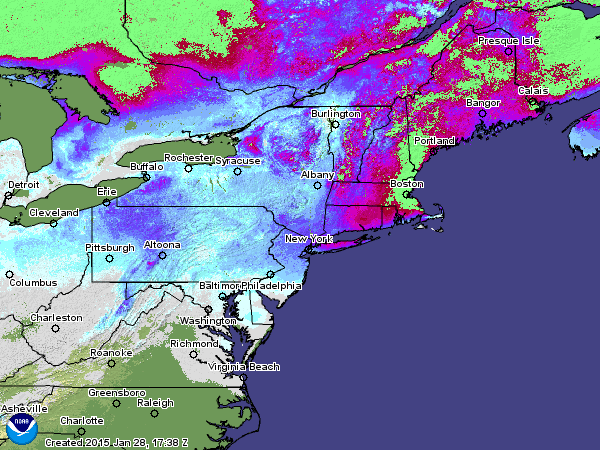
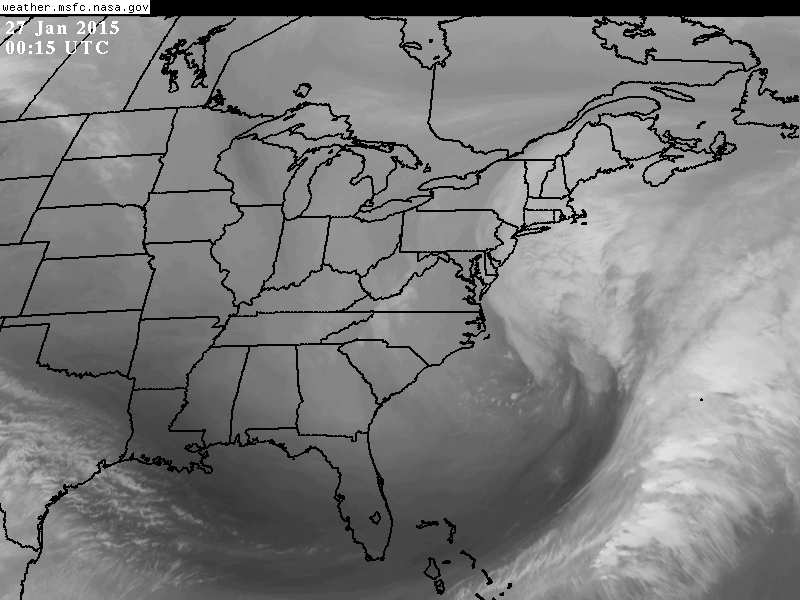
Verification:
Good data from CDUS41…PNS…and F6 bulletins.
Suspect observations
PWM/s 2.37" liquid on the 27th slightly less than a 10:1 SLR.
The 7-group @ 12z/28th is much lower.
Estimated liquid: 0.95”
BTV/s 0.03" liquid on the 27th ==> 120:1 SLR.
PNSBOX carried 27" @HYA; however ... vicinity reports averaged 22".
New Daily Records:
MON … 26-JAN-15
ISP - 7.5"
(4.5"; 1987)
TUE … 27-JAN-15
ORH - 31.9"
(11"; 2011)
PWM - 22.8"
(8.3"; 1963)
BOS - 22.1"
(8.8"; 2011)
ISP - 17.3"
(9.6"; 2011)
PVD - 16"
(6.7"; 2011)
BGR - 14.9"
(10.8"; 1963)
CON - 12.8"
(6.2"; 1963)
JFK - 5.6"
(4.3"; 2011)
---