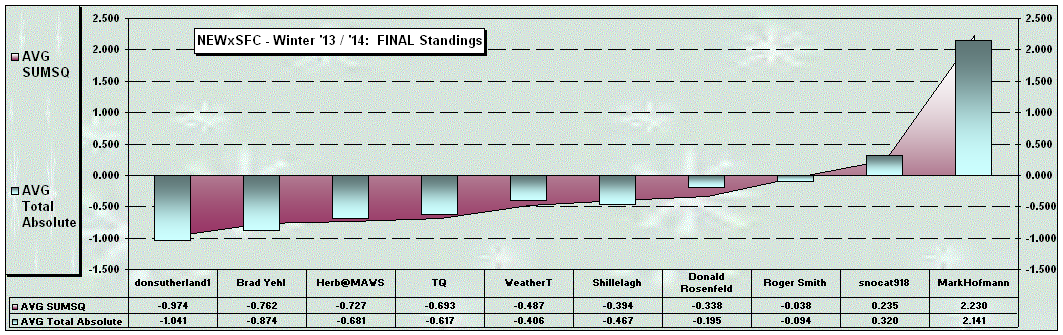
Winter ’13 / ’14 FINAL
standings.
There were eight (8)
contest-worthy storms this season.
Under the ‘two-thirds’
rule…forecasters who entered at least six (6) forecasts are included in the
FINAL standings.
Forecasters’ storm summary
data here
|
NEWxSFC - Winter '13
/ '14: FINAL Standings |
AVG SUMSQ |
AVG STP |
AVG Total Absolute |
AVG Absolute |
Mean RSQ |
|
||||||||||||||||||||
|
Previous Ranks |
Rank |
Forecaster |
Class |
Total STN 4casts |
Error (") |
Error Z |
% MPRV over AVG |
Rank |
4cast (") |
Error |
Error Z |
% MPRV over AVG |
Rank |
Error (") |
Error Z |
% MPRV over AVG |
Rank |
Error (") |
Error Z |
%MPRV over AVG |
Rank |
RSQ |
RSQ Z |
% MPRV over AVG |
Rank |
Forecaster |
|
1,1,1,1,1 |
1 |
donsutherland1 |
Chief |
138 |
97 |
-0.974 |
57% |
2 |
107 |
15 |
-0.518 |
41% |
6 |
33.3 |
-1.041 |
33% |
2 |
1.4 |
-1.164 |
35% |
2 |
82% |
1.115 |
22% |
2 |
donsutherland1 |
|
3,3,3,3,2 |
2 |
Brad Yehl |
Journeyman |
133 |
176 |
-0.762 |
49% |
3 |
127 |
24 |
-0.365 |
32% |
6 |
44.4 |
-0.874 |
32% |
2 |
1.9 |
-0.776 |
27% |
3 |
76% |
1.147 |
38% |
3 |
Brad Yehl |
|
2,2,2,2,3 |
3 |
Herb@MAWS |
Senior |
136 |
189 |
-0.727 |
51% |
4 |
128 |
25 |
-0.486 |
43% |
6 |
50.3 |
-0.681 |
25% |
4 |
2.2 |
-0.663 |
24% |
5 |
70% |
0.708 |
20% |
3 |
Herb@MAWS |
|
5,4,5,5,4 |
4 |
TQ |
Senior |
125 |
122 |
-0.693 |
48% |
4 |
97 |
18 |
-0.481 |
38% |
5 |
36.5 |
-0.617 |
23% |
5 |
1.8 |
-0.696 |
24% |
5 |
78% |
0.680 |
12% |
4 |
TQ |
|
6,5,4,4,5 |
5 |
WeatherT |
Senior |
134 |
192 |
-0.487 |
36% |
5 |
111 |
18 |
-0.507 |
40% |
6 |
50.0 |
-0.406 |
16% |
6 |
2.2 |
-0.340 |
14% |
6 |
67% |
0.399 |
21% |
6 |
WeatherT |
|
3,6,6,6,6 |
6 |
Shillelagh |
Senior |
135 |
285 |
-0.394 |
31% |
7 |
118 |
32 |
-0.328 |
28% |
6 |
56.9 |
-0.467 |
19% |
6 |
2.4 |
-0.416 |
17% |
6 |
64% |
0.317 |
6% |
6 |
Shillelagh |
|
8,7,7,8,8 |
7 |
Donald Rosenfeld |
Senior |
133 |
285 |
-0.338 |
28% |
7 |
111 |
33 |
-0.057 |
-2% |
7 |
59.4 |
-0.195 |
10% |
8 |
2.5 |
-0.112 |
7% |
8 |
63% |
0.280 |
1% |
7 |
Donald Rosenfeld |
|
7,8,8,7,7 |
8 |
Roger Smith |
Senior |
149 |
347 |
-0.038 |
8% |
8 |
142 |
21 |
-0.313 |
37% |
6 |
63.4 |
-0.094 |
6% |
7 |
2.5 |
-0.273 |
10% |
6 |
60% |
0.074 |
-1% |
8 |
Roger Smith |
|
12,11,9,11,10 |
9 |
snocat918 |
Intern |
136 |
399 |
0.235 |
-18% |
9 |
148 |
40 |
0.110 |
-19% |
7 |
74.3 |
0.320 |
-17% |
9 |
3.2 |
0.374 |
-16% |
10 |
56% |
-0.321 |
-13% |
9 |
snocat918 |
|
11,12,10,10,11 |
10 |
MarkHofmann |
Senior |
140 |
1196 |
2.230 |
-186% |
13 |
205 |
105 |
2.024 |
-193% |
12 |
126.4 |
2.141 |
-87% |
13 |
5.5 |
2.132 |
-84% |
13 |
34% |
-1.570 |
-47% |
13 |
MarkHofmann |
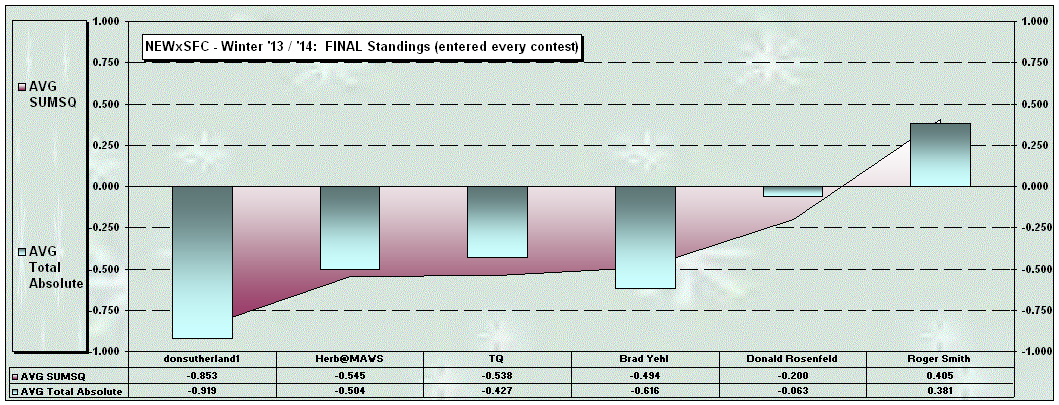
FINAL standings (forecasters
who entered all eight Contests)
|
NEWxSFC - Winter '13
/ '14: FINAL Standings |
|
AVG SUMSQ |
AVG STP |
AVG Total Absolute |
AVG Absolute |
Mean RSQ |
|
||||||||||||||||||
|
Rank |
Forecaster |
Class |
Total STN 4casts |
Error (") |
Error Z |
% MPRV over AVG |
Rank |
4cast (") |
Error |
Error Z |
% MPRV over AVG |
Rank |
Error (") |
Error Z |
% MPRV over AVG |
Rank |
Error (") |
Error Z |
%MPRV over AVG |
Rank |
RSQ |
RSQ Z |
% MPRV over AVG |
Rank |
Forecaster |
|
1 |
donsutherland1 |
Chief |
180 |
151 |
-0.853 |
56% |
2 |
110 |
21 |
-0.492 |
39% |
6 |
40.5 |
-0.919 |
32% |
3 |
1.8 |
-1.012 |
33% |
2 |
76% |
0.970 |
20% |
2 |
donsutherland1 |
|
2 |
Herb@MAWS |
Senior |
171 |
178 |
-0.545 |
39% |
4 |
108 |
23 |
-0.356 |
33% |
6 |
45.2 |
-0.504 |
19% |
5 |
2.1 |
-0.465 |
17% |
5 |
72% |
0.586 |
15% |
4 |
Herb@MAWS |
|
3 |
TQ |
Senior |
177 |
236 |
-0.538 |
37% |
5 |
104 |
31 |
-0.250 |
18% |
7 |
51.2 |
-0.427 |
16% |
6 |
2.2 |
-0.481 |
17% |
6 |
68% |
0.420 |
4% |
5 |
TQ |
|
4 |
Brad Yehl |
Journeyman |
165 |
163 |
-0.494 |
37% |
4 |
105 |
25 |
-0.171 |
18% |
6 |
41.1 |
-0.616 |
26% |
3 |
1.9 |
-0.481 |
20% |
3 |
76% |
0.770 |
30% |
3 |
Brad Yehl |
|
5 |
Donald Rosenfeld |
Senior |
171 |
270 |
-0.200 |
17% |
7 |
108 |
28 |
-0.124 |
5% |
7 |
56.3 |
-0.063 |
4% |
8 |
2.5 |
0.047 |
1% |
8 |
63% |
0.034 |
-2% |
7 |
Donald Rosenfeld |
|
6 |
Roger Smith |
Senior |
186 |
392 |
0.405 |
-31% |
9 |
124 |
32 |
0.190 |
2% |
7 |
63.7 |
0.381 |
-13% |
8 |
2.8 |
0.141 |
-7% |
7 |
63% |
-0.055 |
-2% |
8 |
Roger Smith |
Top 10 Forecasts: lowest SUMSQ by Z-score
|
|
|
Sum Square |
|||||
|
Storm
# |
Date |
Forecaster |
Class |
Error |
Error Z |
%MPROV
over AVG |
Rank |
|
2 |
3-Jan-14 |
donsutherland1 |
Senior |
99.85 |
-1.269 |
60.8% |
1 |
|
3 |
21-Jan-14 |
Brad Yehl |
Journeyman |
140.53 |
-1.171 |
54.2% |
1 |
|
8 |
17-Mar-14 |
donsutherland1 |
Senior |
36.64 |
-1.121 |
61.7% |
1 |
|
8 |
17-Mar-14 |
TQ |
Senior |
40.46 |
-1.048 |
57.8% |
2 |
|
2 |
3-Jan-14 |
Herb@MAWS |
Senior |
130.15 |
-1.021 |
48.9% |
2 |
|
3 |
21-Jan-14 |
donsutherland1 |
Senior |
164.24 |
-1.004 |
46.4% |
2 |
|
1 |
14-Dec-13 |
Herb@MAWS |
Senior |
67.10 |
-0.980 |
76.0% |
1 |
|
3 |
21-Jan-14 |
emoran |
Senior |
170.86 |
-0.957 |
44.3% |
3 |
|
1 |
14-Dec-13 |
TQ |
Senior |
90.43 |
-0.873 |
67.6% |
2 |
|
7 |
12-Mar-14 |
donsutherland1 |
Senior |
103.69 |
-0.841 |
53.7% |
1 |
Top 10 Forecasts: lowest
Total Absolute Error by Z-score
|
|
|
Total Absolute |
|||||
|
Storm
# |
Date |
Forecaster |
Class |
Error |
Error Z |
%MPROV
over AVG |
Rank |
|
8 |
17-Mar-14 |
donsutherland1 |
Senior |
16.0 |
-1.381 |
34.2% |
1 |
|
2 |
3-Jan-14 |
donsutherland1 |
Senior |
43.1 |
-1.292 |
31.1% |
1 |
|
3 |
21-Jan-14 |
Brad Yehl |
Journeyman |
48.5 |
-1.132 |
30.5% |
1 |
|
3 |
21-Jan-14 |
emoran |
Senior |
49.0 |
-1.106 |
29.8% |
2 |
|
1 |
14-Dec-13 |
Brad Yehl |
Journeyman |
27.2 |
-1.053 |
52.2% |
1 |
|
4 |
5-Feb-14 |
Brad Yehl |
Journeyman |
28.5 |
-1.042 |
35.0% |
1 |
|
2 |
3-Jan-14 |
Herb@MAWS |
Senior |
47.0 |
-1.033 |
24.8% |
2 |
|
6 |
3-Mar-14 |
Donald
Rosenfeld |
Senior |
22.7 |
-0.998 |
52.8% |
1 |
|
4 |
5-Feb-14 |
donsutherland1 |
Senior |
29.4 |
-0.981 |
33.0% |
2 |
|
1 |
14-Dec-13 |
donsutherland1 |
Senior |
29.4 |
-0.973 |
48.3% |
2 |
Top 10 Forecasts: highest RSQ by Z-score
|
Storm |
Date |
Forecaster |
Class |
RSQ |
RSQ Z |
%MPROV
over AVG |
Rank |
|
5 |
12-Feb-14 |
Brad Yehl |
Journeyman |
53.7% |
1.850 |
110.1% |
1 |
|
3 |
21-Jan-14 |
Brad Yehl |
Journeyman |
74.0% |
1.769 |
45.8% |
1 |
|
5 |
12-Feb-14 |
WeatherT |
Senior |
50.2% |
1.618 |
96.3% |
2 |
|
8 |
17-Mar-14 |
donsutherland1 |
Senior |
87.2% |
1.473 |
9.3% |
1 |
|
3 |
21-Jan-14 |
donsutherland1 |
Senior |
68.6% |
1.356 |
35.1% |
2 |
|
1 |
14-Dec-13 |
Herb@MAWS |
Senior |
88.0% |
1.279 |
32.9% |
1 |
|
7 |
12-Mar-14 |
Brad Yehl |
Journeyman |
88.0% |
1.170 |
21.3% |
1 |
|
7 |
12-Mar-14 |
donsutherland1 |
Senior |
86.8% |
1.077 |
19.6% |
2 |
|
1 |
14-Dec-13 |
TQ |
Senior |
84.3% |
1.061 |
27.3% |
2 |
|
8 |
17-Mar-14 |
TQ |
Senior |
85.1% |
1.057 |
6.7% |
2 |
Top 10 Forecasts: lowest STP error by Z-score
|
|
|
STP |
||||||
|
Storm |
Date |
Forecaster |
Class |
(") |
Error
(") |
Error Z |
%MPROV
over AVG |
Rank |
|
3 |
21-Jan-14 |
emoran |
Senior |
114.15 |
4.3 |
-1.512 |
90.0% |
1 |
|
3 |
21-Jan-14 |
WeatherT |
Senior |
104.90 |
5.0 |
-1.486 |
88.5% |
2 |
|
8 |
17-Mar-14 |
donsutherland1 |
Senior |
42.76 |
1.9 |
-1.417 |
88.3% |
1 |
|
6 |
3-Mar-14 |
Donald
Rosenfeld |
Senior |
49.25 |
16.6 |
-1.070 |
62.2% |
1 |
|
2 |
3-Jan-14 |
snocat918 |
Intern |
170.55 |
1.1 |
-1.043 |
95.6% |
1 |
|
8 |
17-Mar-14 |
TQ |
Senior |
50.71 |
6.1 |
-1.006 |
62.7% |
2 |
|
4 |
5-Feb-14 |
Herb@MAWS |
Senior |
114.40 |
0.7 |
-0.976 |
95.3% |
1 |
|
4 |
5-Feb-14 |
Mitchel
Volk |
Senior |
114.60 |
0.9 |
-0.962 |
93.9% |
2 |
|
3 |
21-Jan-14 |
MarkHofmann |
Senior |
91.01 |
18.8 |
-0.946 |
56.3% |
3 |
|
2 |
3-Jan-14 |
Brad Yehl |
Journeyman |
175.05 |
3.5 |
-0.932 |
85.4% |
2 |
---
To qualify for ranking in
the Interim and FINAL ‘End-of-Season’ standings…a forecaster must enter at
least two-thirds of all Contests. If a forecaster has made more than
enough forecasts to qualify for ranking…only the lowest SUMSQ Z-scores necessary
to qualify are used in the computing the average. IOW…if you made nine
forecasts…only your six best SUMSQ Z-scores are used to evaluate your
season-to-date performance. You can think of it as dropping the
worse quiz scores before your final grade is determined.
The reason we have this rule
is to 1) make it possible to miss entering a forecast or two throughout the
season and still be eligible for Interim and ‘End-of Season’ ranking and 2)
encourage forecasters to take on difficult and/or late-season storms without
fear about how a bad forecast might degrade their overall 'season-to-date'
performance score(s).
The mean normalized ‘SUMSQ
error’ is the Contest/s primary measure of forecaster performance.
This metric measures how well the forecaster/s expected snowfall
'distribution and magnitude' for _all_ forecast stations captured the
'distribution and magnitude' of _all_ observed snowfall amounts. A
forecaster with a lower average SUMSQ Z Score has made more skillful forecasts
than a forecaster with higher average SUMSQ Z Score.
The 'Storm Total
Precipitation error’ statistic is the absolute arithmetic difference
between a forecaster/s sum-total snowfall for all stations and the observed
sum-total snowfall. This metric…by
itself…is not a meaningful measure of skill…but can provide additional insight
of forecaster bias.
The 'Total Absolute
error' statistic is the average of your forecast errors regardless of
whether you over-forecast or under-forecast.
This metric measures the magnitude of your errors.
The 'Average Absolute
Error' is the forecaster/s ‘Total Absolute Error’ divided by the
number of stations where snow was forecast or observed.
The ‘RSQ error’
statistic is a measure of the how well the forecast captured the variability of
the observed snowfall. Combined with
the SUMSQ error statistic…RSQ provides added information about how strong the
forecaster/s ‘model’ performed.