Complete Results @ http://www.newx-forecasts.com/
Follow the left-side link from 'Storm-total Contest Verified Forecasts’ – Contest #6 to see the complete station forecast verification table.
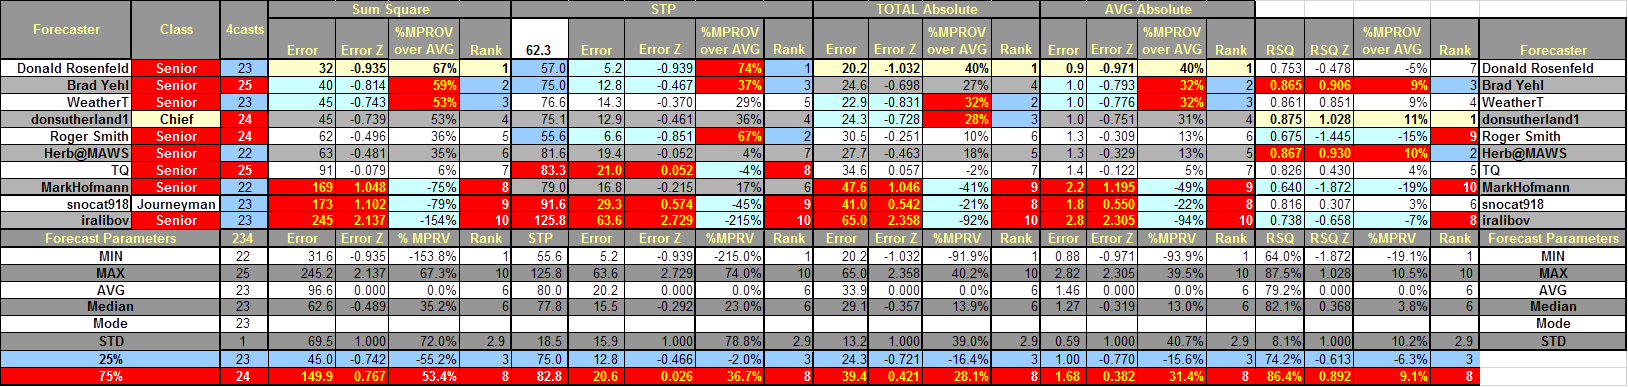
In the table...
Yellow cells indicate the best score in category.
Forecast STP cells are yellow if within +/- 5% of observed STP.
Blue (Red) cells indicate the top (lower) 25% percentile.
SUMSQ: sum of square errors
STP: storm total precipitation
TAE: total absolute
error
AAE: average absolute error
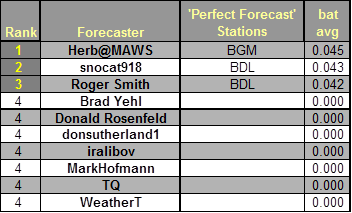
Final Standings - all Forecasters
Perfect Forecasts
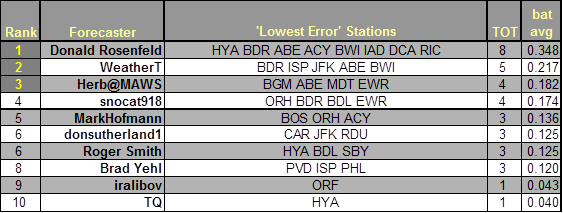
Best Station Forecasts (Batting Average - Percentage of Forecast Stations with Lowest Absolute Error)
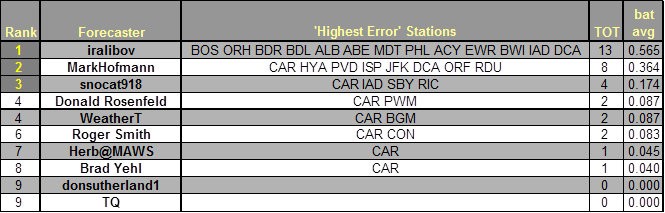
Best Station Forecast Busts (Batting Average - Percentage of Forecast Stations with Highest Absolute Error)
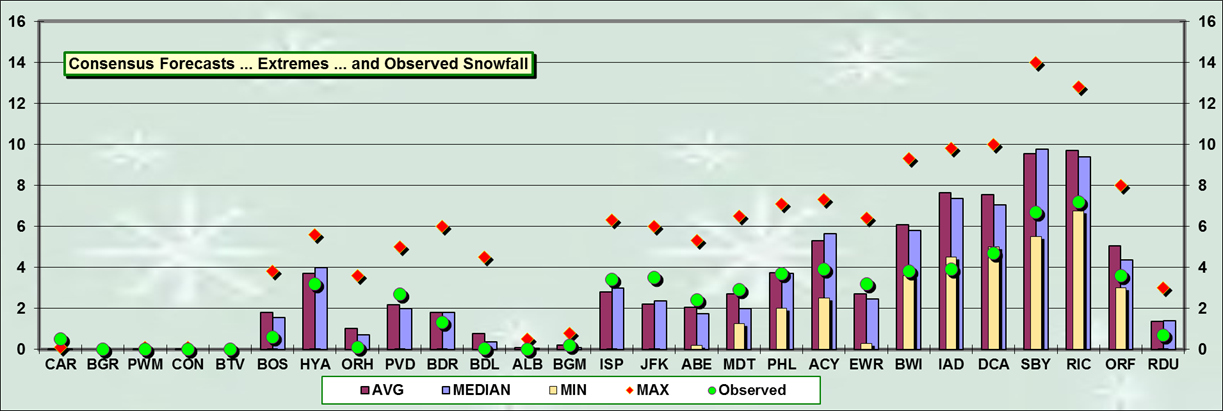
Consensus forecast best @ HYA … PVD … ISP … ABE …MDT …PHL … EWR
MAX forecast best @ CAR
MAX forecast less than observed @ CAR
MIN forecasts best @ BWI …IAD …DCA …SBY …RIC …ORF
MIN forecasts more than observed @ IAD …DCA
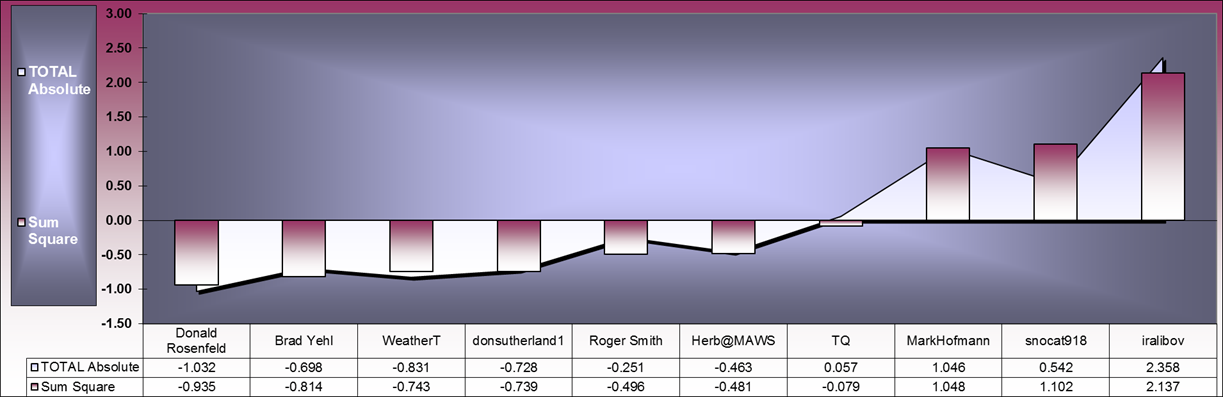
Good association between SUMSQ and TAE Z-scores
*******************************
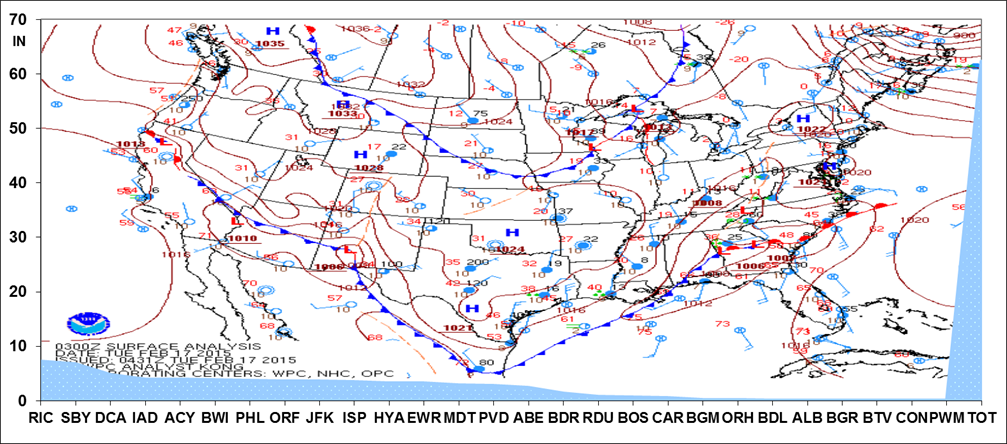
Verification:
Good data from CDUS41…PNS…and F6 bulletins.
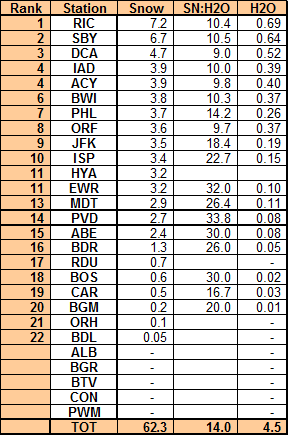
SBY/s STP estimated by applying RIC/s SN:H2O
(10.4:1) to SBY/s storm-total liquid precipitation.
HYA/s STP
interpolated from vicinity reports carried in PNSBOX.
New Daily Records:
TUE ... 17-FEB-15
ISP - 3.4" (2.5"; 1996)
---
---