Complete Results @ http://www.newx-forecasts.com/
Follow the left-side link from 'Storm-total Contest Verified Forecasts’ – Contest #1 to see the complete station forecast verification table.
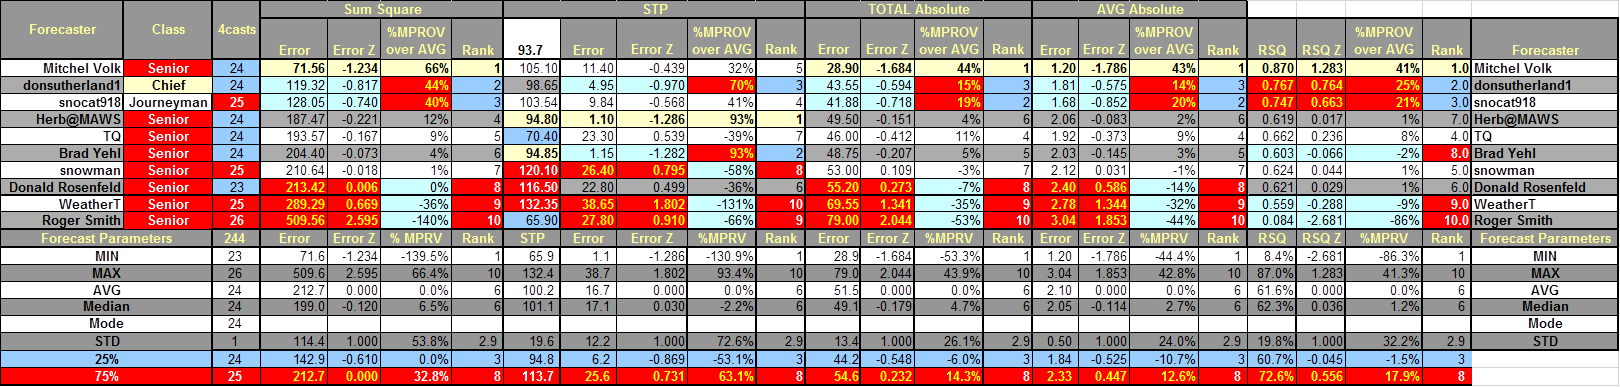
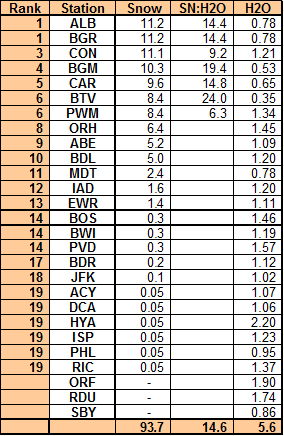
In the table...
Yellow cells indicate the best score in category.
Forecast STP cells are yellow if within +/- 5% of observed STP.
Blue (Red) cells indicate the top (lower) 25% percentile.
SUMSQ: sum of square errors
STP: storm total precipitation
TAE: total absolute
error
AAE: average absolute error
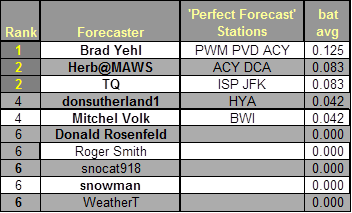
Final Standings - all Forecasters
Perfect Forecasts
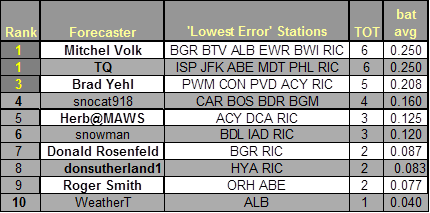
Best Station Forecasts (Batting Average - Percentage of Forecast Stations with Lowest Absolute Error)
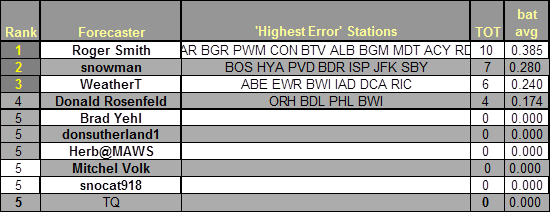
Best Station Forecast Busts (Batting Average - Percentage of Forecast Stations with Highest Absolute Error)
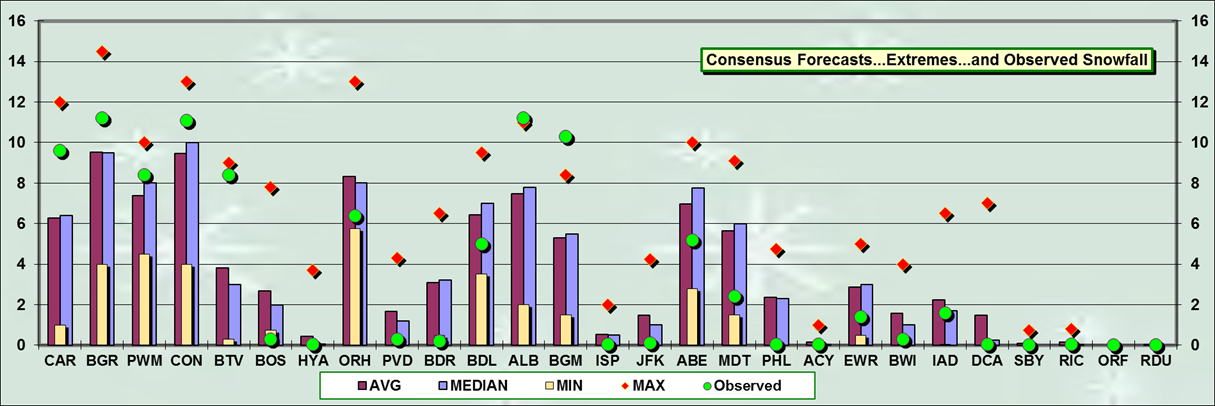
Consensus forecast best @ PWM
MAX forecast best @ CAR … BTV …ALB … BGM
MAX forecast less than observed @ ALB
MIN forecasts best @ BOS …PVD …BDR … ISP … JFK MDT … ACY …BWI … DCA
MIN forecasts more than observed @ BOS
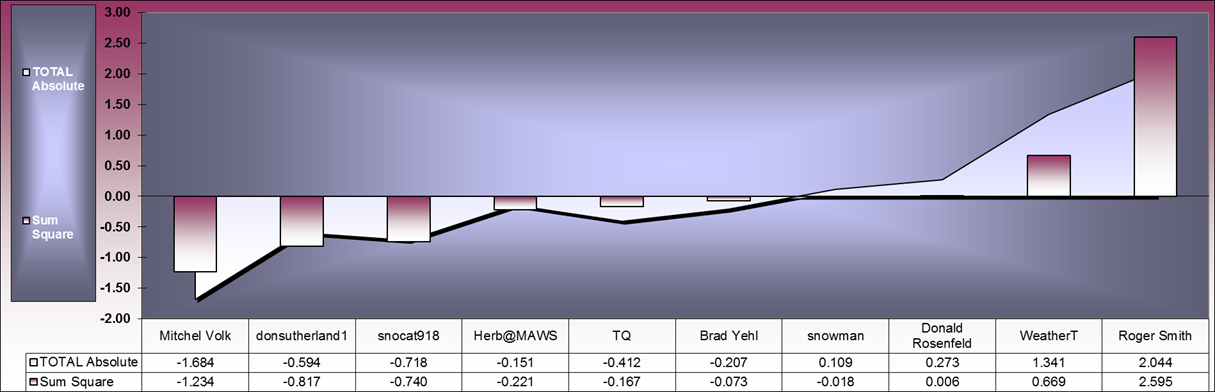
Good association between SUMSQ and TAE Z-scores
*******************************
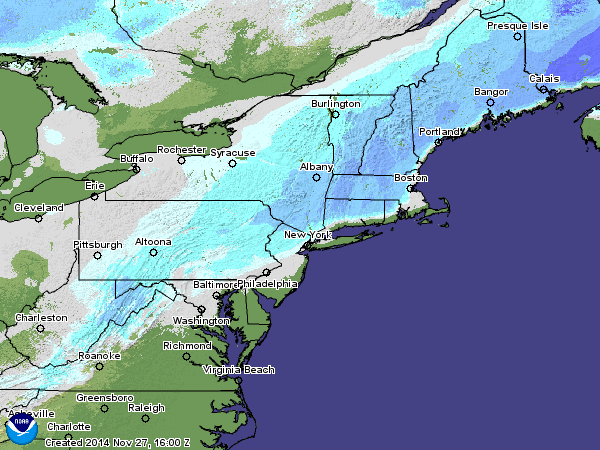
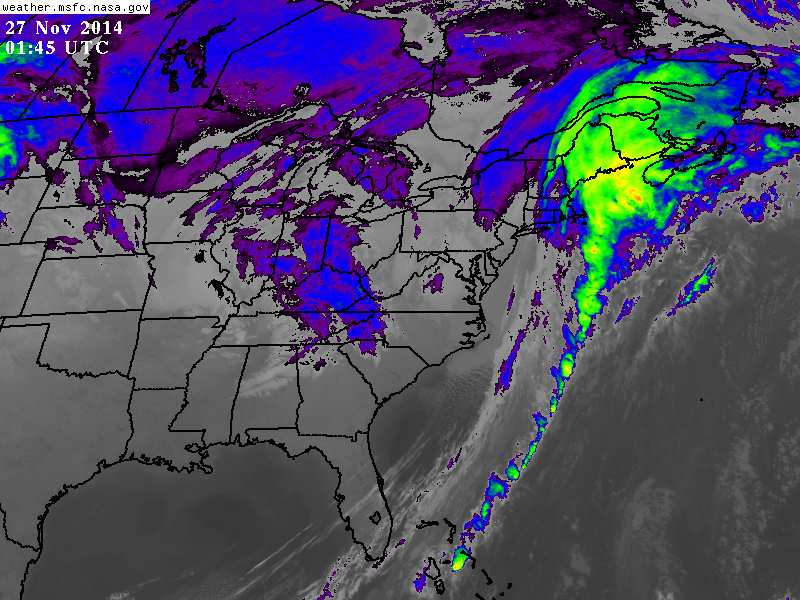
Verification:
Good data from CDUS41…PNS…and F6 bulletins.
PWM/s 6.3 SN:H20 appears to be close since there was 20 minutes of light mixed precipitation before turning to all snow.
New Daily Records:
WED … 26-NOV-14
CON - 10.3" (4.5"; 1956)
ALB - 9.6" (4.9"; 1888)
BGM - 9" (8.7"; 1977)
PWM - 7.4" (7"; 1885)
ORH - 5.3" (2.9"; 1921)
ABE - 4.9" (1.7"; 1925)
BDL - 4.6" (0.4"; 1985)
IAD - 1.6" (1.1"; 1978)
ACY - 0.05" (0.05"; 1977)
Two new daily rainfall records:
WED ... 26-NOV-14
ORH - 1.79" (1.78"; 1958)
RDU - 1.69" (0.98”; 1979)
---